Quantcast
Channel: Richard Geldreich's Blog
Viewing all 302 articles
Browse latest View live

CoCo 3 Upgrades: Hitachi 6309 CPU, 512KB RAM, PS2 keyboard

$
0
0
Installed a bunch of CoCo 3 upgrades from Cloud-9 Tech over the weekend:

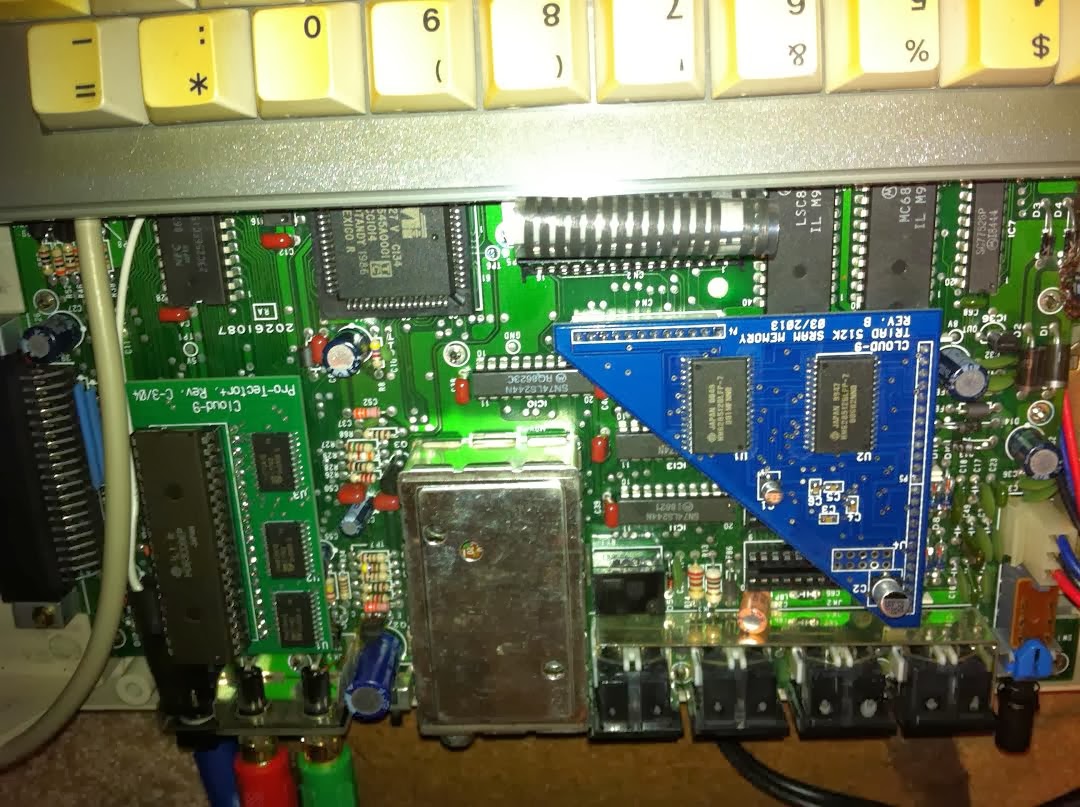
  • I upgraded the old 68B09 CPU to the powerful Hitachi 63C09. This involved desoldering the old CPU and replacing it with a socket. I also put in a Pro-Tector+ board to protect the CPU from the inevitable torture I have planned for this thing (once I get all of my electronics gear out of storage and back in one place).


  • The Cloud-9 512K Triad upgrade board (the blue triangle) was trivial to install by comparison. Following the instructions, I removed the four old (128K) RAM chips, snipped a couple capacitors, and plugged it in:


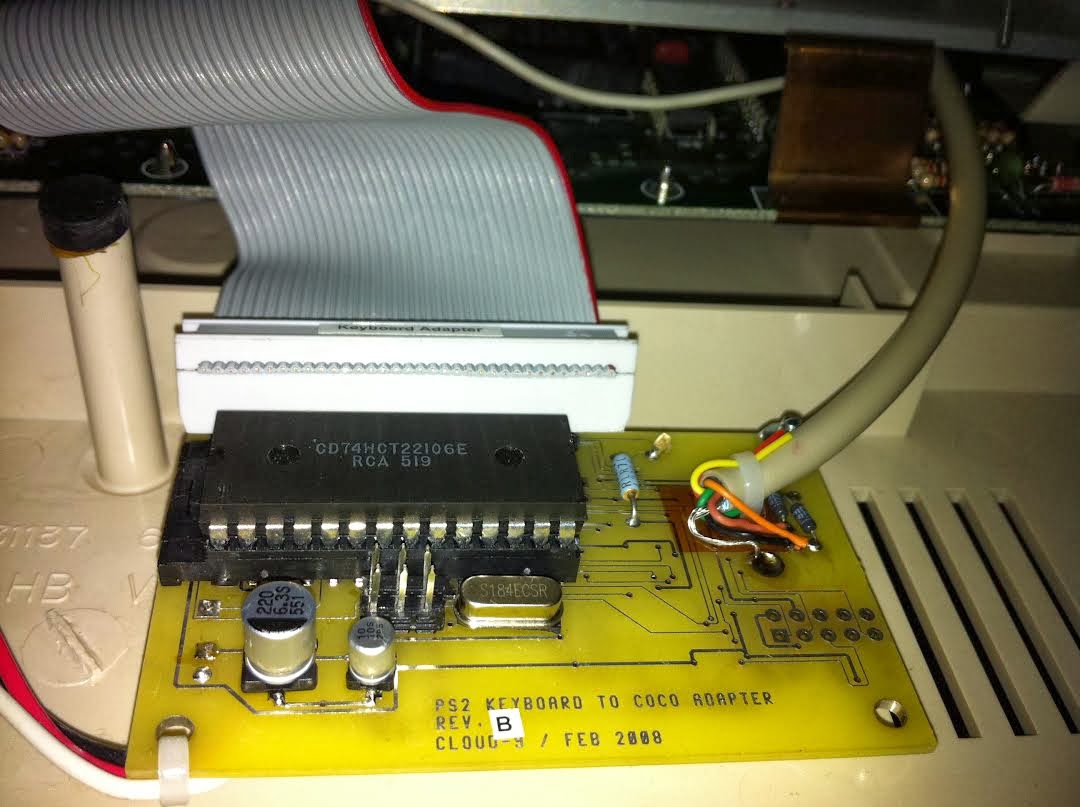
  • Cloud-9 also sells a nice PS2-keyboard upgrade board which was an easy install (no soldering):


I enabled 6309 native mode (15%+ faster vs. 6809 mode) and tested it with my gcc6809 compiled test program. Here it is outputting text to the 40x24 text mode:


I'm currently scrolling the text screen up using a simple C routine. It's so embarrassingly slow right now (even at 1.89MHz 6309 native mode) that you can kinda see the scroll function move the lines up the screen. But this is fine for simple printf()-style debug output. I'm using this BSD-licensed tiny printf() for embedded applications.

I've also compiled in the DriveWire 4 assembly 115kbps/230kbps I/O routines into this test app, so I can do disk I/O without relying on OS/9 or the BASIC ROM routines. My plan going forward is to continue completely "taking over" the machine and just do my own thing (no OS at all). It should be easy to code up a DriveWire compatible I/O disk module (here's the DriveWire protocol specification).


Source level debugger and monitor app for 6809/6309 CPU

$
0
0
I've been working on a Linux OpenGL debugger for about a year now, so I figured it would be fun and educational to create a low-level CPU debugger just to learn more about the problem domain. (I'll eventually use all this stuff to remotely debug on various tiny microcontrollers, so there's some practical value in all this work too.) To make the effort more interesting (and achievable in my spare time), I'm doing it for the simple 6809/6309 CPU's and interfacing it to an old 8-bit computer (Tandy CoCo3) over a serial port. (Yes, I could emulate all this stuff, but there's not nearly as much fun in that. I want to work with *real* hardware!)

I first wrote a small monitor program for the 6809, so I could remotely control and debug program execution over the CoCo3's "bit banging" serial port. There's a bit of assembly to handle the stack manipulation, but it's written entirely in C otherwise using gcc6809. This monitor function lives in a single SWI (software interrupt) handler and only supports very basic ops: read/write memory, read/write main program's registers (which are popped/pushed on the main program's stack in the SWI handler), ping, "trampoline" (copy memory from source/destination and transfer control to the specified address), or return from the SWI interrupt handler and continue main program execution. The monitor also hooks FIRQ and enables the RS-232 port's CD (carrier detect) level sensitive interrupt so I can remotely trigger asynchronous breakpoints by toggling the DTR pin. (My DB9->CoCo serial cable is wired so DTR from the PC is hooked up to the CoCo's CD pin.)

With this design I can remotely do pretty much anything I want with the machine being debugged. Once the remote machine is running the monitor I can write a new program to memory and start it (even overwriting the currently executing program and monitor using the trampoline command), examine and modify memory/registers, implement new debugging features, etc. without having to modify (and then possibly debug) the 6809 monitor function itself.

The client app is written in C++ in the VOGL codebase and supports the usual monitor-type commands, plus a bunch of commands for debugging, 6809/6309 disassembly, loading DECB (Microsoft Disk Extended Color BASIC) .bin files into memory, dumping memory to .bin files, etc. It supports both assembly and simple source level debugging. You can single step by instructions or lines (step into, step over, or step out), get callstacks with symbols, and print parameters and local variables. I'm parsing the debug STAB information generated by gcc in the assembly .S files, and the NOICE debug information generated by aslink to get type and symbol address information.

Robust callstacks are surprisingly tough to get working. The S register is constantly manipulated by the compiler and there's no stack base register when optimizations are enabled. So it's hard to reliably determine the return addresses without some extra information to help the process along. To get callstacks I modified gcc6809 to optionally insert a handful of prolog/epilog instructions into each generated function (2 at the beginning and 1 at the end). The prolog sequence stores the current value of the S register into a separate 256-byte stack located at absolute address 0x100. (It stores a word, but the stack pointer is only decremented by a single byte because I only care about the lowest byte of the stack register. My stacks are <= 256 bytes.) The debugger reads this stack of "stack pointers" to figure out what the S register was at the beginning of each function. It can then determine where the return PC's are located in the real system hardware stack.

The 6809 code to do this uses no registers, just a single global pointer at absolute address 0xFE and indirect addressing:

0x0628 7A 00 FF         _main:                  DEC   $00FF (m15+0xF0)          
0x062B 10 EF 9F 00 FE                           STS   [$00FE (m15+0xEF)]        
0x0630 34 40                                    PSHS  U                         
0x0632 33 E4                                    LEAU  , S                       
0x0634 func: _main line: test.c(101):
    coco3_init();
0x0634 BD 0E 9E                                 JSR   _coco3_init ($0E9E)       
0x0637 func: _main line: test.c(103):
monitor_start();
0x0637 BD 08 03                                 JSR   _monitor_start ($0803)    
0x063A func: _main line: test.c(105):
coco3v_text_init();
0x063A BD 25 64                                 JSR   _coco3v_text_init ($2564) 
0x063D func: _main line: test.c(106):
    core_printf("start\r\n");
0x063D 8E 06 20                                 LDX   #$0620                    
0x0640 34 10                                    PSHS  X                         
0x0642 BD 1D 5C                                 JSR   _core_printf ($1D5C)      
0x0645 32 62                                    LEAS  2, S                      
0x0647 func: _main line: test.c(108):
test_func();
0x0647 BD 03 8F                                 JSR   _test_func ($038F)        
0x064A func: _main line: test.c(110):
    core_hault();
0x064A BD 1D F7                                 JSR   _core_hault ($1DF7)       
0x064D func: _main line: test.c(112):
    return 0;
0x064D 8E 00 00                                 LDX   #$0000                    
0x0650 7C 00 FF                                 INC   $00FF (m15+0xF0)         
0x0653 func: _main line: test.c(113):
}

0x0653 35 C0                                    PULS  PC, U                     

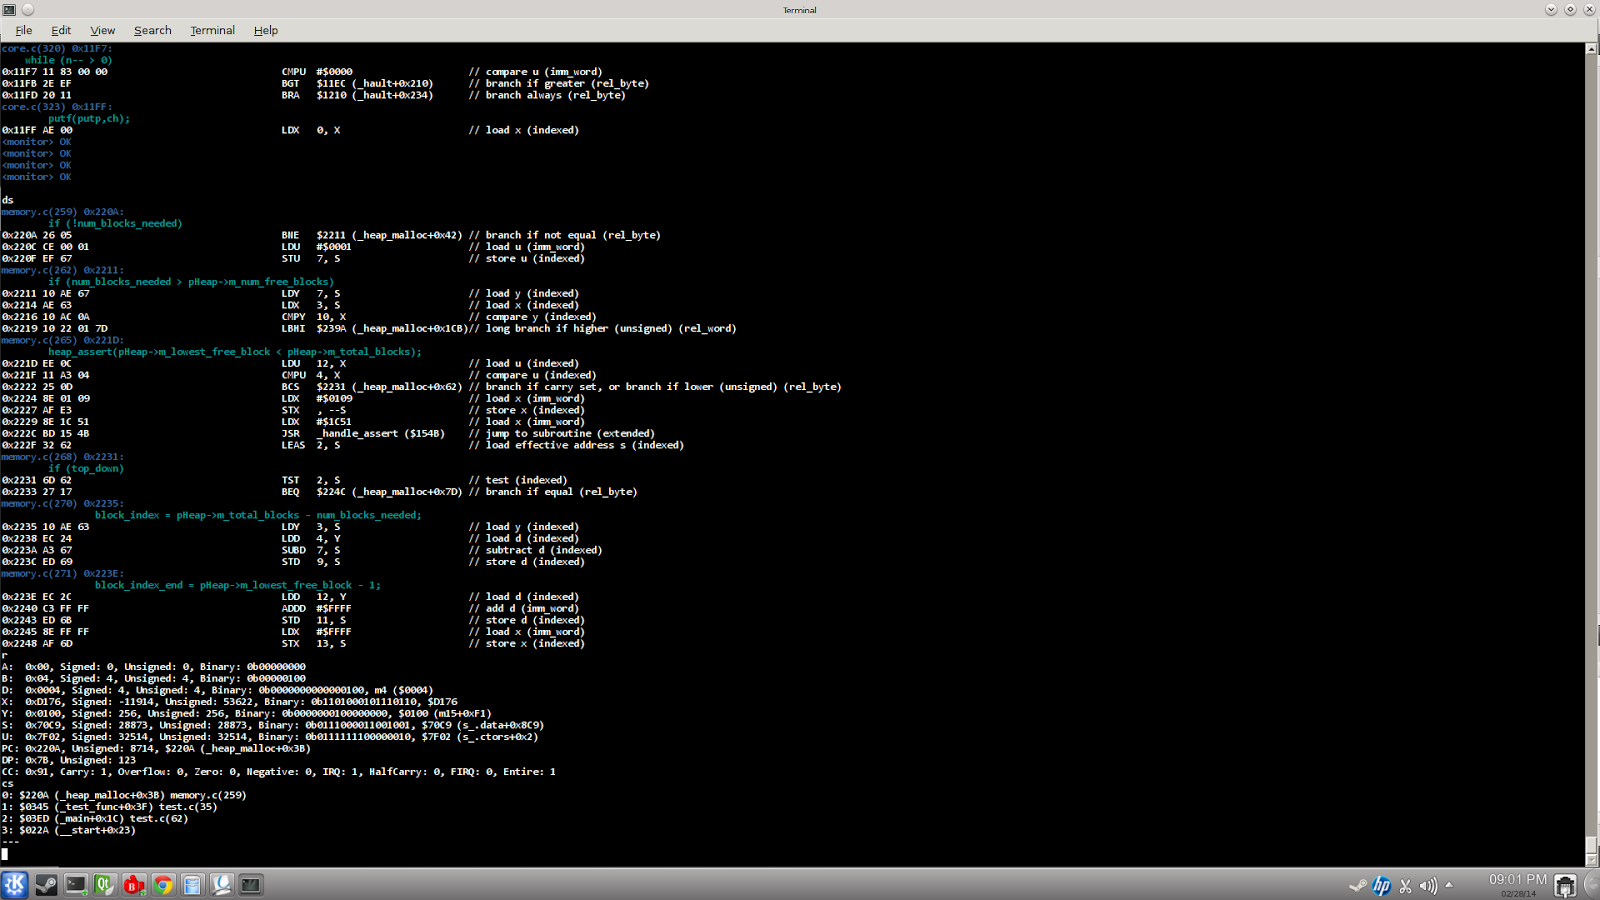
Some pics of the monitor client app, showing source level disassembly, callstacks, symbols, etc. The monitor's serial protocol is mostly synchronous and I'm paranoid about checksumming everything (because bit banging at 115200 baud is not 100% robust on this hardware).


Here's the physical hardware running a heap test program. The cross platform C codebase compiles on both the PC using clang, and on the CoCo using gcc6809. I'm doing this cross platform because it's still *much* easier to debug on the PC using QtCreator vs. remotely debugging using my monitor app. Using the monitor to debug problems, even with symbols, makes me totally appreciate how good QtCreator's debugger actually is!


Finished Up Support for the Hitachi 6309 CPU

$
0
0
I've added Hitachi 6309 support to my disassembler, monitor interrupt handlers, and monitor client. So I'm now able to switch over my 6809 test app to use the 6309's "native" mode, which is something like 15-30% faster. I can single step over 6309 code sequences and display/modify the extra registers (E/F/V). I verified my disassembler by using the a09 6809/6309 cross assembler to assemble a bunch of test 6309 code, disassemble it, then diff the results vs. the original code. Lomont's 6309 Reference and The 6309 Book are the best references I've found.

The 6309 is amazingly powerful for its time. You've got some 32-bit ops, fast CPU memory transfers, hardware division/multiplication, various register to register ops, and two more 16-bit regs to play with over the 6809 (W and V, although V is limited to exchanges/transfers). W is hybrid register, useful as a pointer or general purpose register. I've written a good deal of real mode (16-bit segmented) 8086/80286 assembly back in the day, and I really like the feel of 6309 assembly.


Unfortunately, the assembler used by gcc6809 (as6809) doesn't support the 6309. The gcc6809 package comes with a 6309 assembler (as6309), but it doesn't compile out of the box. I got it to compile but it's very clear that whoever worked on it never finished it. I made a quick stab at fixing up as6309 but to be honest the C code in there is like assembly code (with unfathomable 2-3 letter variable names and obfuscated program flow), and I don't have time to get into it for a hobby project.

So for now, I'm using the a09 assembler (which does support 6309) to create position independent code (at address 0) contained in simple .bin files which I convert to as09 assembly source files. The .s files contain nothing but ".byte 0xXX" statements and the symbols. To get the symbols I manually place a small symbol table at the end of the .bin file that is automatically located and parsed using a custom command line tool which converts the a09 assembled .bin file to .s assembly files:

                code
                org     $0

;------------------------------------------------------------------------------
; void _math_muli_16_16_32(int16 left_value, int16 right_value, int32 *pResult)
;------------------------------------------------------------------------------

; x - int16 left value
; stack: 
; 2,3 - int16 right value
; 4,5 - int32* result_ptr 

_math_muli_16_16_32:

right_val = 2
result_ptr = 4

tfr x,d
muld right_val, s
stq [result_ptr, s]
rts

;------------------------------------------------------------------------------
; Define public symbols, processed by cc3monitor -a09 <src_filename.bin>
;------------------------------------------------------------------------------

fcb 0x12, 0x35, 0xFF, 0xF0

fcc "_math_muli_16_16_32$"
fcw _math_muli_16_16_32

This gets converted to an .s file which the gcc6809 tool chain likes:

.module asmhelpers
.area .text
.globl _math_muli_16_16_32
_math_muli_16_16_32:
.byte 0x1F
.byte 0x10
.byte 0x11
.byte 0xAF
.byte 0x62
.byte 0x10
.byte 0xED
.byte 0xF8
.byte 0x4
.byte 0x39

This is a cheesy hack but works fine (for a hobby project).

togl D3D9->OpenGL layer source release on github

$
0
0
This is a raw dump of the togl layer right from DoTA2:
https://github.com/ValveSoftware/ToGL

This is old news by now; I think the press picked up on this even before I heard it was finally released. I really wish we had the time to package it better (so you could actually compile it!) with some examples, etc. There's a ton of practical Linux GL driver know-how packed all over this code -- if you look carefully. Every Valve Source1 title ultimately goes through this layer on Linux/Mac. (The Mac ports do use a different, much earlier branch, however. At some point the Linux and Mac branches merged back together, but I don't know if that occurred in time for DoTA's version.)

We talked a lot about what we learned while working on this layer at GDC last year:

Porting Source to Linux: Valve's Lessons Learned
https://www.youtube.com/watch?v=btNVfUygvio

Or here:
https://developer.nvidia.com/gdc-2013

There's a lot of history to this particular code. This layer was first started by the Mac team, then later ported from Mac to Linux by the Steam team, and then finally ported by the Linux team to Windows (!) so we could actually debug it. (Because the best available GL debuggers at the time were Windows-only. We are working to correct that with vogl.) John McDonald, Rick Johnson, Mike Sartain, Pierre-Loup Griffais and I then got our hands on it (at various times) to push it down the correctness (for Source1) and performance axes. I spent many months agonizing over this layer's per-batch flush path: tweaking, profiling (with Rad's awesome Telemetry tool), optimizing, and testing it to run the Source1 engine correctly, quickly, and reliably on the drivers available for Linux.

The code is far from perfect: many parts are more like a battleground in there. It's optimized for results, and the primary metrics for success were perf vs. Windows and Source1 correctness, sometimes to the detriment of other factors. A lot of experiments were conducted, some blind alleys were backed out of, and we learned *a lot* about the true state of OpenGL drivers during the effort. If you want to see how to stay in the "fast lanes" of multiple Linux GL drivers simultaneously it might be worth checking out. (Most of the Linux drivers share common codebases with the Windows GL drivers, so a lot of what's in there is relevant to Windows GL too.)

(The first version of this post stated there was another version of togl that supported both Mac and Linux, and had all the SM3 fixes I made for various projects. Turns out the version on github is the very latest version, because all the togl branches were merged back into Dota2 at some point.)

vogl GL debugger source is on github

$
0
0
We promised at Steam Dev Days we would open source the project, so here it is:
https://github.com/ValveSoftware/vogl

Creating a OpenGL debugger that handles both full-stream tracing *and* state snapshotting (with compat profile support to boot!) is a surprisingly massive undertaking for ~3 devs, so please bear with us. We're knee deep in fleshing out the UI and improving the tracer/replayer to be fully compatible with GL v3.3 (4.x will be later this year). Please file bug reports on github and send us trace logs (or apitrace/vogl traces), etc. and we'll do our best to make it work with your app.

We'll be posting more instructions and our current TODO list on the wiki soon.

We're currently in the process of adding PBO support (done, testing it right now), and we've added the ability to snapshot while buffers are mapped during replaying. (Both things are needed to trace/replay/snapshot Steam 10ft.)

zip64 version of the miniz library released as part of the vogl codebase

$
0
0
miniz is my (mostly) drop-in zlib replacement library:
http://code.google.com/p/miniz

Anyhow, the version of miniz on Google Code only supports zip32, but I added full support for zip64 and a bunch of other features in my spare time last year. I used vogl to test the new code, which you can find the source to here:

https://github.com/ValveSoftware/vogl/blob/master/src/voglcore/vogl_miniz_zip.cpp
https://github.com/ValveSoftware/vogl/blob/master/src/voglcore/vogl_miniz.cpp

The files are marked ".cpp" but it's just plain C code. I need to re-run the latest new code through a C compiler again, but there shouldn't be anything in there that C can't handle. If there is I'll fix it. zip64 was a real pain to fully implement, and next time I will definitely choose a cleaner archive format.

I need to extract this code from the vogl codebase (should be relatively easy as miniz is an independent blob of code) and do a standalone release at some point.

miniz is probably one of my most popular open source libraries. Between all the Microsoft games that used my earlier lossless codecs (Age of Empires 1/2, Halo 3 and I think one of its sequels, Forza 2, Halo Wars) and miniz my compression code has found its way into a bunch of shipped products. One of my other compression libs (picojpeg) is now in orbit on the Skycube nano-satellite, which should be fully deployed from the ISS by the end of the month after its shakedown period is over. I do compression stuff purely for the fun of it so it's pretty cool to see what people wind up doing with it.


Notes on current vogl limitations

$
0
0
All debuggers have limitations. Most of the time, you don't really know what they are until they pop up while you're trying to debug something (usually at the worst time, after wasting many hours). So here's a list of vogl limitations/issues I've been compiling (which will go up on the wiki once it's setup):

Note: All this is on the vogl wiki now: https://github.com/ValveSoftware/vogl/wiki
  • We don't support LD_PRELOAD-style tracing on Optimus setups. 
I would like to support it, but honestly it's challenging enough to do this on vanilla desktop stacks. Once you throw 2 drivers in there all bets are off with all the tracers I've tried. Any help in this area would be great.

We do support manually loading our tracer (libvogltrace32/64.so) on Optimus, but it's not something I've had the time to test much. To do this, manually load libvogltrace and dlsym() the gliGetProcAddressRAD()function (to be renamed to voglGetProcAddress()).

  • Can't take state snapshots during tracing or replaying while any buffers are currently mapped. 
This is typically not a problem because almost all apps just map a buffer, poke around inside the mapped region (reading and/or writing with the CPU), then unmap and move on.

I'm currently working on removing this restriction during replaying (which is easy because we fully control all GL contexts during replaying), but reliably removing this limitation during tracing in all scenarios seems challenging.

  • PBO (pixel pack and unpack buffers) not supported in the current github drop
This is already implemented and is being tested with Steam 10ft traces. I'll hopefully push it up by the end of the week.

  • GL 4.x is not supported for full-stream or snapshotting
There's a lot of GL 4.x stuff that will work, but it's not been a priority to support the latest bleeding edge stuff. Almost all shipped GL products I'm seeing only use GL 3.x, at best. Interestingly, the biggest/most ported releases tend to use a very conservative set of GL v2/v3.

  • Cubemap arrays not supported for snapshotting yet (but are OK for full-stream)
Here's the list of texture types we can snapshot: 1D, 2D, RECTANGLE, CUBE_MAP, 1D_ARRAY, 2D_ARRAY, 3D, 2D_MULTISAMPLE, and 2D_MULTISAMPLE_ARRAY. Incomplete textures are OK, but you'll get a warning if you haven't properly set GL_TEXTURE_MAX_LEVEL (which you most definitely should always do because not doing so is unreliable in practice).

  • Abuse of GL handles+multiple contexts
Sadly GL handles behave in interesting and obscure ways once you introduce sharelists. So before you delete textures (and most other objects) you should make sure they are not bound on other contexts before you delete them, otherwise you're going down a direction that you'll probably regret (and that will give vogl headaches). vogl will give you errors on this scenario when you try to snapshot. For example:

Let's say you create a second context that shares with your first context. It gens a texture (handle=1), binds it on both contexts, calls glTexStorage() to initialize it, then deletes the texture on the 1st context. Everything appears as expected on the 1st context: the texture becomes auto-unbound, glIsTexture() reports false, and I can't retrieve the texture's width anymore (using glGetTexLevelParameteriv()). All nice and neat.

But on the 2nd context, the texture remains bound, glIsTexture() returns false, but I can still retrieve the texture's width. If I call glGenTextures() handle 1 gets immediately reused, even though it's still bound (as reported by glGet() on GL_TEXTURE_BINDING_2D) and even though I can retrieve texture 1's width. At this point handle 1 means two different things (!) on this specific context, which is most wonderful. If I then rebind texture handle 1 (which was just re-genned) I can no longer retrieve the width.

  • Can't snapshot textures after they are deleted (but still bound elsewhere)
We support snapshotting shaders that have been attached to programs and then immediately deleted. We also support snapshotting programs that have been deleted but are still bound. These are pretty common GL patterns we've seen in a few major titles. At program link time we make a deep copy of all attached shaders (called the "link time snapshot" in the code), so we can guarantee we can snapshot and recreate the program's actual linked state no matter what the app does with the shaders after linking.

However, there are other scenarios (such as binding a texture to a FBO, then deleting the texture but keeping it bound to the FBO) that we don't fully support for snapshotting. This scenario may never be fully supported: the last time I tried I couldn't query state of deleted (but still bound) textures on at least one driver, and we're not going to deeply shadow all texture state to work around this. Luckily, I've only ever seen this done purposely in one app so far, and the attached texture was not actually used for rendering purposes after the deletion. (They kept it attached to keep their hands on the GPU memory so the driver wouldn't reclaim it.)

vogl will spit out an error and typically try to continue snapshotting when it encounters a handle attached to an object that has been deleted (and we've lost track of). You'll get a handle remap error, because we won't know how to remap the handle from the GL replay domain back into the trace domain. The snapshot may cause the replayer to diverge, though.

  • During replaying the default (GLX) framebuffer is always 32-bit RGBA, no MSAA, with a 24/8 depth stencil buffer. 
On the todo list, but this hasn't been a problem so far. Apps that use MSAA tend to use renderbuffers or maybe MSAA textures, probably because this is more portable (vs. mucking around with the default GLX framebuffer's setup). It's possible for an app replay to diverge if the default framebuffer has a configuration that it didn't have during tracing, but in practice I haven't seen this happen.

  • Replay window auto-resizing can be a problem in some apps
Unlike apitrace, we only use a single replay window and resize it as needed. The auto-resize logic can get stuck resizing too much. This problem pops up most often in GLUT/FreeGLUT apps. We can capture/replay them, but the replayer's window code tends to get confused by the GLUT UI window activity. It'll still replay properly, but slowly as the replayer auto-resizes the replay window. 

If the window auto-resizes too much use "-lock_window_dimensions -width X -height Y" on the voglreplay command line to lock the replay window to a fixed size.

We may switch to apitrace-style multiple windows, or maybe pbuffers, to work around this (needs investigation).

  • We can't snapshot inside of glBegin/glEnd regions.
We didn't think it was worth the extra complexity to be able to snapshot/restore incomplete glBegin sequence, so either snapshot right before or right after the region. (Hey, at least we support snapshotting apps that use glBegin at all!)

  • Display list limitations
No recursion and no resources can be bound in the display list but textures. We do support around 400 API's inside of display lists. GL display lists are ancient API's at this point, so I don't think we'll do much more in this area unless a big title from the past uses them. (We do already support Doom3's usage of GL display lists, though.)

  • Be careful deleting contexts that share lists with other contexts
We support tracing/replaying/snapshotting/restoring the state of multiple contexts. vogl has the concept of "root" contexts and "sharelist groups". A sharelist group is 2 or more contexts that share objects, and the first context created in this group (that doesn't, and can't, share with anything else) is marked as the "root" context for that group.

vogl can't snapshot state if the "root" context of a sharelist group is destroyed while other leaf contexts are still present. Either snapshot immediately after all the leaf contexts are destroyed, or reorder your context deletions so the root gets killed last. In 99% of cases none of this matters; most apps just delete all their contexts at once or just leak them at exit.

  • Forking while tracing
I've encountered problems with this on some apps (mostly Mono ones I think). Needs investigation, we haven't tested it.

  • Try to delete your contexts when exiting
We've got several hooks in there to make sure the trace is properly flushed and closed when apps exit and leak their contexts. These hooks work most of the time, but it's best if you properly tear down your contexts when you exit.

The replayer does support unflushed traces (with no trace archive at the end), but there are no guarantees.

Also, not properly tearing down your contexts before exiting actually makes it very difficult for us to fully flush any in-progress asynchronous PBO readbacks (used for real-time JPEG capturing).

  • UI limitations
The entire UI is still very, very new. The texture, renderbuffer, and default framebuffer viewer in particular is very basic. It has little support for viewing traces that have multiple contexts.

Peter Lohrmann is working on improving the UI. We're currently using it to help us debug the debugger itself, which is progress, but there's a bunch of work left before I would try using it to debug a title with it.

  • Driver compat
I've tested the most on NVidia, a moderate amount on AMD, and (unfortunately) very little on Intel's open source driver so far. (Not purposely - it's just a time limitation.) We mostly ping-pong between NVidia and AMD as driver bugs pop up and we wait for the vendor to provide us with fixes. A developer at LunarG is now helping us get vogl working on Intel's open source driver.

  • Program binary gotchas
If you trace a 32-bit app that uses program binaries, on at least 1 driver (NVidia) you must replay using the 32-bit replayer (same for 64-bit). You can forcefully disable the app's usage of program binaries while tracing using --vogl_disable_gl_program_binary. This flag causes the tracer to remove the GL_ARB_get_program_binary extension string, and it'll also force the driver to always fail links with program bins (in case you don't check the string).

We've gone back and forth with always disabling program binaries by default in the tracer, but at the end of the day we take the policy of changing the app's behavior during tracing as little as possible unless you have purposely chosen to override something.

Note program binaries are usually *extremely* fragile, so traces containing program binaries may only be replayable on the exact driver version you captured them on.

  • Can't take a snapshotting while tracing if other threads have contexts current
We take the snapshot immediately after the next glXSwapBuffers() call. The tracer will attempt to make each context current on the same thread that calls glXSwapBuffer()'s so it can take a snapshot, but it won't be able to do this if the app has the context current on the other thread. So don't leave your contexts current across swaps if you want to take a snapshot. (We couldn't think of a reliable/robust way around this limitation.)

To snapshot during tracing, write a file named "__trigger_capture__" to the app's current directory and the tracer will immediately take a snapshot. You can take as many snapshots as you want while tracing. (Of course, you can't have specified "--vogl_tracefile X" on your command line, which would have put the tracer into full-stream mode.) I'll better document this within a day or so, for now just search the code in vogl_intercept.cpp.


  • Replayer whitelist
If the tracer encounters a GL/GLX function it knows the replayer won't be able to handle it'll give you an error when it encounters the call. The call will be written to the trace as best the tracer can, and the call will go directly to the driver, but the replayer will ignore it (after spitting out an error message). When you exit the traced app, you'll get a list of non-whitelisted funcs that were actually called during tracing. The func whitelist is the union of the API's contained in two files:
https://github.com/ValveSoftware/vogl/blob/master/glspec/gl_glx_whitelisted_funcs.txt
https://github.com/ValveSoftware/vogl/blob/master/glspec/gl_glx_simple_replay_funcs.txt

You can still try to replay this trace, but it may diverge or horribly fail. To see a more detailed whitelist, run the "voglgen" tool with the -debug option in the glspec directory.

Some of the newer GL debug related funcs aren't in the whitelist yet, I'll be adding them in very soon.

You'll get warnings if you call GetProcAddress() on GL/GLX functions that are not in the whitelist. This is typically harmless, most apps use GL extension libraries that retrieve the addresses of hundreds to thousands of GL funcs they never actually call.


vogl's github wiki is up


Completed another round of testing on AMD's (fglrx) driver

$
0
0
I fixed a number of issues specific to AMD's driver - changelist notes are here. Mike should hopefully push these changes to github out tonight or tomorrow latest. (3/15: These changes are live on github - thanks Mike!)

Here's Dota2 replaying on fglrx in -interactive mode. Also, our regression test suite is now working (for the first time!) on AMD, which is pretty exciting.

The GL API callstream involved is hairy - it's kinda amazing that it works at all:

- I traced Dota2 using apitrace on an NVidia 780 to a .trace file
- I played this back on AMD's fglrx using glretrace, then intercepted its output using libvogltrace to a vogl .bin trace file
- I then play this new trace using voglreplay. The regression test suite verifies that the backbuffer CRC's seen during tracing vs. replaying are the same (we've failed if not).

So we're mixing two different drivers and tracing/replaying frameworks in this test. The yellow warnings in the screenshot below are caused by missing uniforms, which are optimized differently by the AMD driver's compiler vs. NVidia (so some program uniforms are missing on AMD, which should be harmless).


Trying SmartGitHg build v6 preview 4

$
0
0
We've been using Mercurial+TortoiseHg for the previous year (with hosting on Bitbucket), but the open source mainstream uses git so we're now switching vogl over to it exclusively. I gather most Linux devs primarily use command line tools, which is fine and all (I obviously do too when needed) but I want to find good GUI's for this stuff. The last time I had to use CLI tools for version control was 1997 under DOS.

There's an added bonus to being obstinate and pushing to find and use good native Linux GUI's for our major devtools: devs porting from the Windows/OSX/console worlds already have huge piles of solid GUI-based tools, and we need to find reasonably competitive native Linux alternatives. (When I say "native", I mean "not under Wine". I use Wine every day to run some old non-critical Windows programs I just can't find Linux alternatives for that I like, such as the Boxer Text Editor and Paint Shop Pro. Wine seems to run older Win32 apps better than Windows 7/8 itself these days!)

So I'm on the lookout for a git UI that is at least as good as TortoiseHg for doing the basics. I found a good Visual Studio alternative (QtCreator) a year ago after a wide search involving around a half dozen other Linux IDE's. I knew QtCreator was a good product after using its debugger for 20 minutes. It's by no means perfect but I've not had to use gdb/cgdb once since switching to it.

SmartGitHg has been on my radar, so I'm trying it out. It's commercial but has a 30 day trial (and is free for non-commercial use). This thing could be unusable -- I have no idea yet.


http://www.syntevo.com/smartgithg/early-access

It needs openjdk-7-jre to run, which I installed first using the Muon package manager (under Ubuntu 13.10+KDE). The UI seems more complex, but cleaner, than TortoiseHg's. If you're already familiar with Mercurial/thg it seems pretty easy to map over the concepts and accomplish the basics. I just pushed a trivial change up using it (added a link to the vogl wiki). I'll keep trying UI's if necessary until something works for 90% of the things devs do (add files, check in, push, pull, merge, resolve conflicts, browse history, etc).

vogl's tracer/replayer now supports the Steam Linux client

$
0
0
Steam's Big Picture mode is one of the last remaining Valve OpenGL apps that vogl didn't support until now. (The desktop client's GL callstream has worked for months.) The fixes for Big Picture are now all pushed to our github repo.

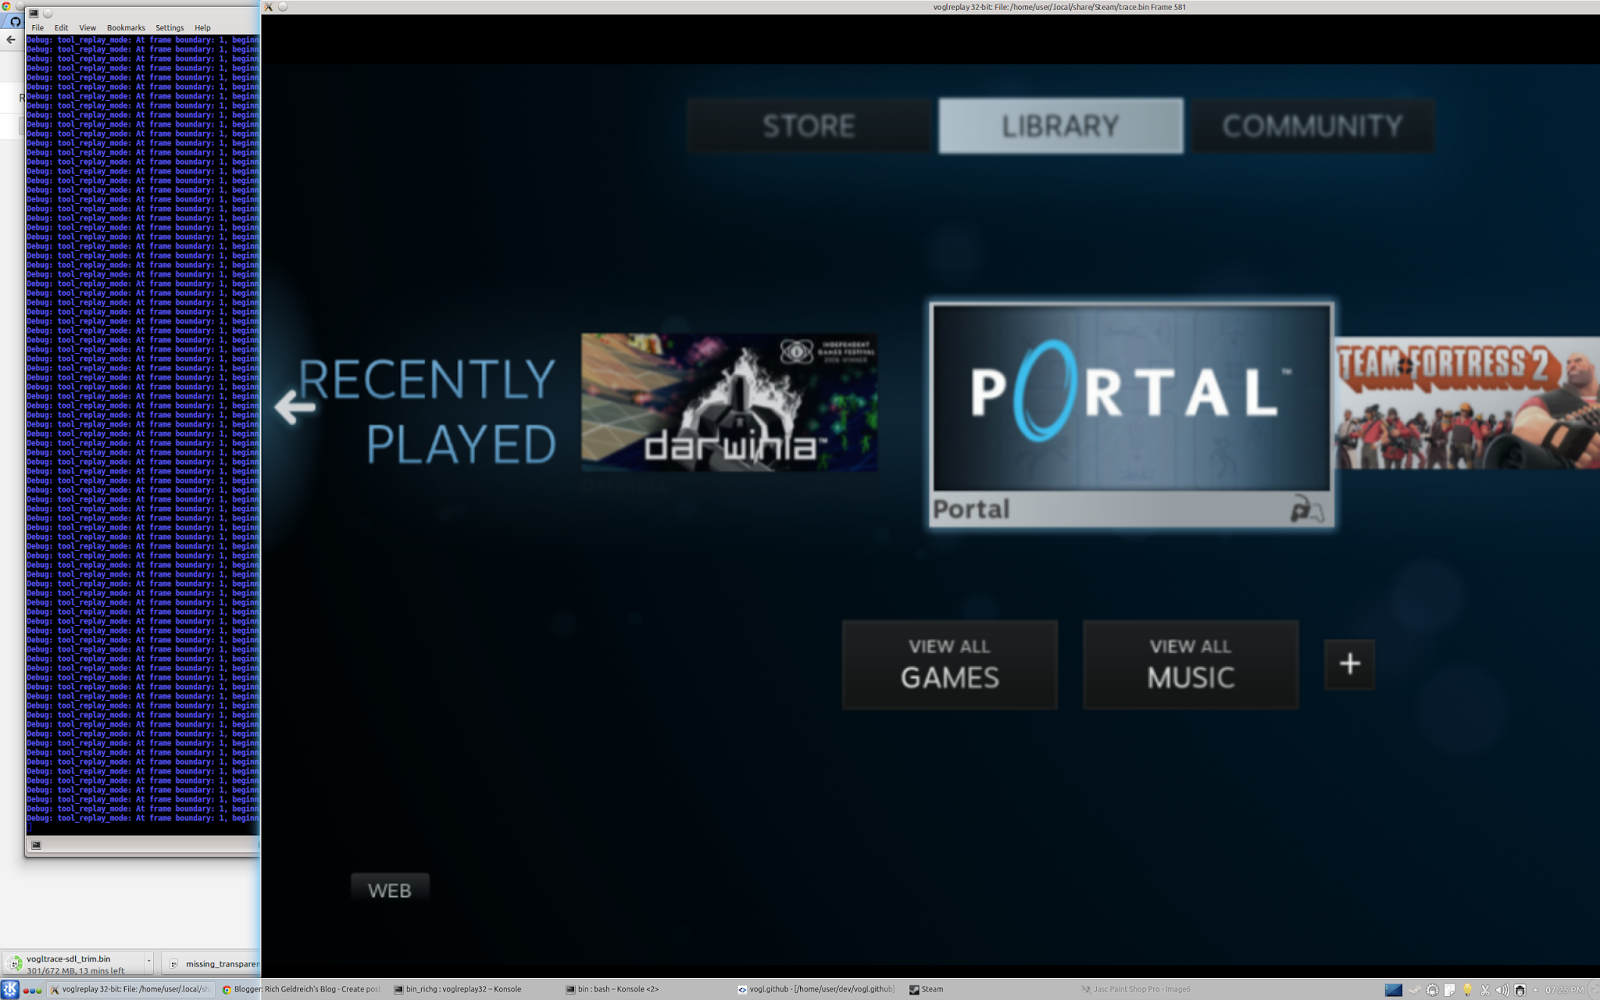
Here's a Big Picture ("10ft") replay in interactive mode after pausing (which involves a full state snapshot, context teardown, and state restore) and continuing playback:


Replaying 10ft traces on NVidia technically works, but there's a driver bug that is causing playback to be extremely slow on my box (that NVidia is checking out). So all tracing and replaying in these shots was done on a AMD 57xx series part using the closed source fglrx driver.

The desktop ("2ft") GL callstream is looking good too, but compared to 10ft I have hardly spent any time looking at it. (I used the "-lock_window_dimensions -width 2560 -height 1600" cmd line options to replay this trace for 10ft, so the window is much bigger than needed for 2ft):


There are some known remaining issues, none of them show stoppers for debugging purposes. I'll be adding this trace to our shiny new regression test system Mike Sartain is working on soon.

- The replayer's auto window resize logic is almost useless on Steam traces because it creates so many trampoline contexts (associated with tiny windows) during startup and mode changes. So you must currently replay using "-lock_window_dimensions -width X -height Y".

- Can't make single/multi-frame snapshots of 10ft during tracing, only replaying. This isn't a big deal, because you can make a full-stream trace and just trim the frames you want to look at.

This problem is caused by the 10ft renderer keeping several buffers mapped all the time. I have a safe and easy fix coming that might address this issue (but it'll only work when the app keeps the entire buffer mapped).

- Can only debug 10ft on AMD until the NVidia driver bug is fixed

- The UI has not been tested on 10ft traces yet. Peter Lohrmann just added better support for debugging traces containing multiple contexts (specifically to help 10ft debugging along) which I'll try soon.

- The 10ft renderer deletes textures while they are still bound to FBO's (and keeps the FBO's around)

This causes various problems for the snapshot code because it can't retrieve the texture attachment handles in these FBO's (we just get 0's for the GL_FRAMEBUFFER_ATTACHMENT_OBJECT_NAME), and (the last time I checked) we can't reliably retrieve information on these deleted textures on all drivers. This seems to be a very rare pattern (that I've never seen in any game titles, just 10ft). After asking around it turns out this problem is not a showstopper for 10ft because it always rebinds a new texture to the same attachment point before it ever renders to the FBO again.

All that red text in the below screenshot is due to this issue, but the output should still be correct.


You don't need to do anything special to trace steam:

./trace.sh /usr/bin/steam

trace.sh is our example tracing script, see here. The example script causes the tracer to wait for a keypress, but you may not see the "waiting for keypress" message - just press any key if the app appears to stop.


couple vogl debugger/editor UI screenshots

$
0
0
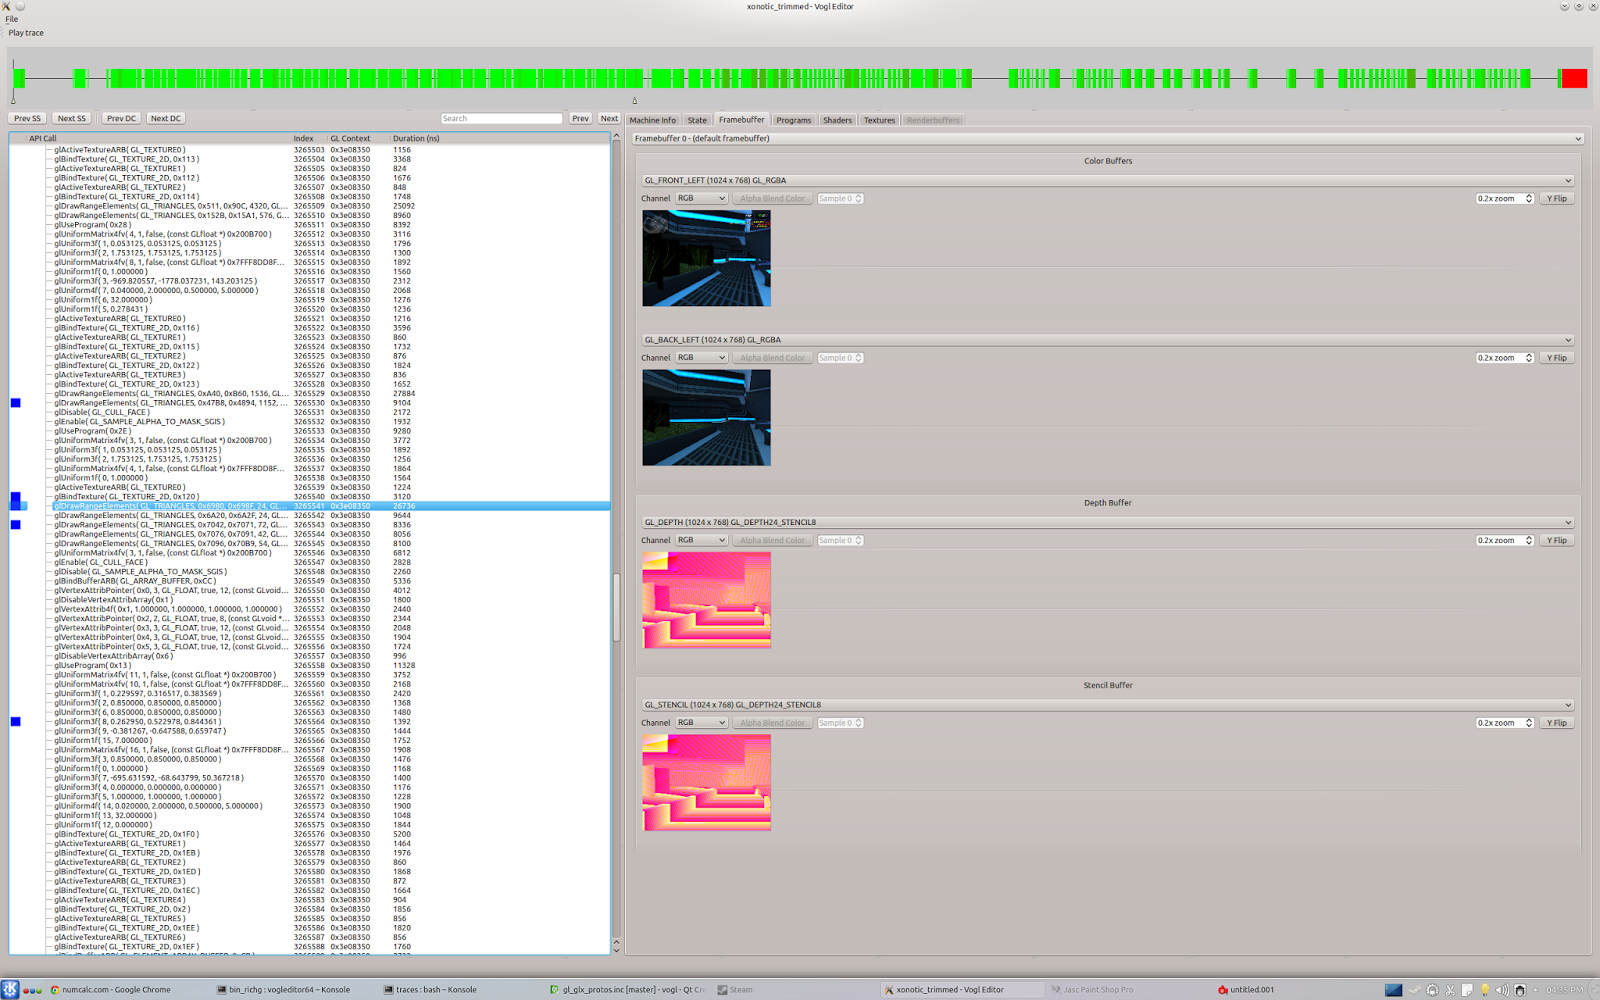
vogl's UI (being worked on by Peter Lohrmann) has come far in the past month. I used it today while debugging what seemed to be a replay bug in Xonotic (reported by a dev named blackout24 on github). I first trimmed a single frame that clearly showed the problem, then played back this trimmed trace in a endless loop to verify the issue still showed up in the trim. I manually trimmed the source trace using voglreplay64, but I think initial support for doing all this directly from the UI just went in.

The UI helped me quickly pinpoint the first draw affected by the rendering problem. I then drilled down and examined all the GL state, textures, shaders, etc. on and around this draw. Clicking on a GL command that already had a snapshot was fast, only around a second in debug, and around 3-4 seconds on commands without snapshots. I still dumped the trimmed trace to JSON+loose files, more out of habit than anything, but using the UI was much faster than doing things the old way (which involved dumping massive amounts of PNG's on each major event, then using voglreplay -find and/or grep on huge JSON files).

Here's the pinpointed draw showing the problem (a completely opaque foliage billboard that should have been rendered transparently):


Depth and stencil buffers are currently displayed by mapping their individual bytes directly to image components - we're working on that.

Here's the foliage texture. I enabled alpha blending in the UI to double check the texture's alpha channel was reasonable:


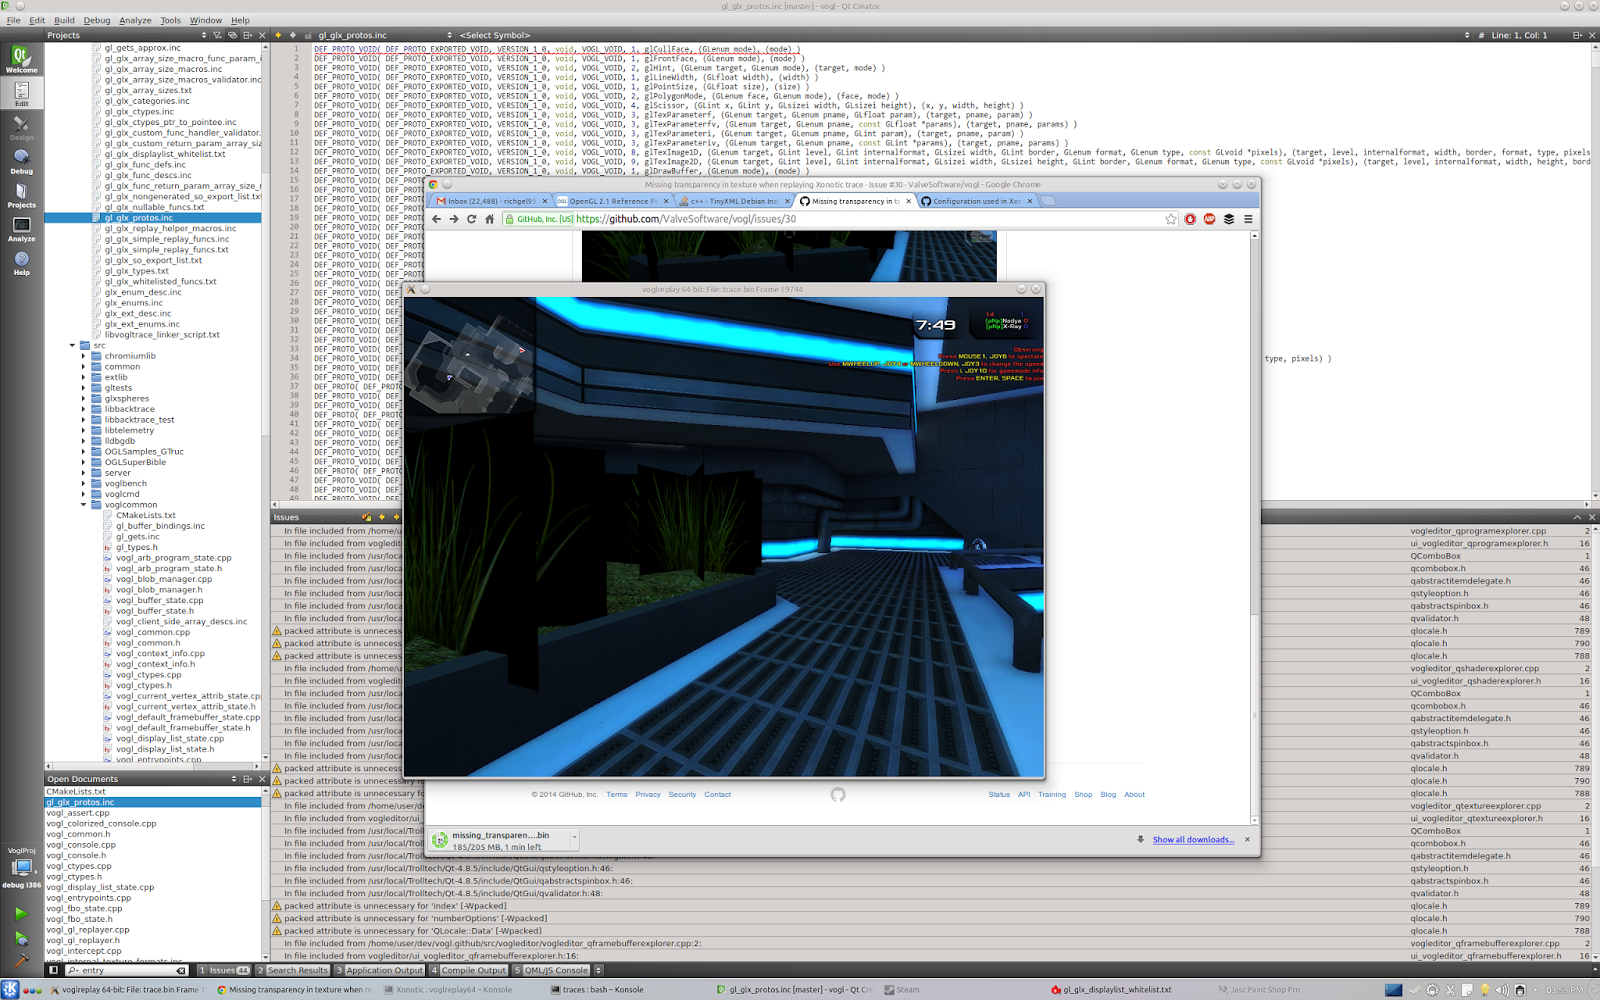
Xonotic replay showing the problem, with the powerful QtCreator IDE in the background:


Turns out the problem was caused by Xonotic's usage of alpha to coverage on a multisampled default framebuffer. We don't currently support automatically enabling multisampling on default framebuffers during replaying. (We do of course support MSAA renderbuffers/textures/FBO's, but not on the default framebuffer yet.)

For now, I added a "-msaa X" command line option to the replayer to enable MSAA on the default framebuffer until we address this. This is crappy, but the vast majority of GL apps just don't enable MSAA this way and we have bigger fish to fry at the moment. (Also, I don't want to touch vogl's GLX/X-Windows related code until we abstract it away into SDL or something.)

vogl support for Unreal Engine 4

$
0
0
We're extremely excited that Epic is porting Unreal Engine 4 to Linux -- see the official announcement or some press here and here. Once we heard UE4 Linux was coming we pretty much dropped everything to ensure vogl can handle UE4 callstreams. The latest code on github now supports full-stream tracing/replaying and trimming of UE4 callstreams in either GL3 or GL4 mode. UI support for UE4 is still in the early stages, but now that we can snapshot/restore UE4 and continue to play back the callstream without diverging it's only matter of time before the UI comes up to speed.

UE4's OpenGL renderer is the most advanced we've worked with so far. It has provided us with valuable real-world test cases for several modern GPU features we've not had traces to validate our code against, such as compute shaders and cubemap arrays. We'll be making UE4 GL callstreams part of our regression test suite going forward.

Here are some shots of a trace of UE4's test game being replayed in voglreplay64's --interactive mode (which relies on state snapshotting/restoring):


Here's a trimmed trace loaded in the editor:


Known problems:

  • UI: Peter Lohrmann just added a dropdown that lets you select which context's state to view. This code is hot off the presses and is a bit fiddly at the moment. Also, UE4 uses several texture formats that the vogl UI can't display right now (LunarG is helping us fix this, see below.)
  • Snapshotting UE4 during tracing is currently unsupported (but snapshotting during replaying works), because the tracer can't snapshot state while any buffers are mapped. (We also have this problem with the Steam Big Picture renderer.) We have a fix in the works.
  • We're seeing several query related warnings/errors while snapshotting and replaying UE4 callstreams. (This problem is in vogl's replayer, not UE4.) These need to be investigated, but they don't seem to cause the replayer to diverge.
  • There are several "zombie" buffer objects that have been deleted on one context but remain bound on another, which causes the snapshot system to report handle remapping errors on these objects during snapshotting. These buffers don't appear to be actually referenced after they are deleted, so this doesn't cause the replay to diverge. We've got some ideas on how to improve vogl's handling of this scenario (which is unfortunately very easy to do by accident in GL).

Other news:

LunarG has provided us with the first drop of their universal OpenGL texture format converter/transformer module, which will be going open source soon. This module allows us to convert any type of OpenGL/KTX texture data to various canonical formats (such as 8-bit or float RGBA) in a driver independent manner, with the optional transforms we need to build a good texture/framebuffer viewer UI. The current vogl UI uses some temporary and very incomplete stand-in code to convert textures to formats Qt accepts, so we're really looking forward to switching to LunarG's solution.

Finally, John McDonald recently joined Valve and the SteamOS team and is currently getting up to speed on the vogl codebase.


vogl Windows port, new regression test system, new vogl_chroot repo

$
0
0

Windows Port Progress


John McDonald has officially begun the Windows port of vogl. The voglcore lib and voglgen (our code generator tool) are now running on Windows as of this morning!


New Regression Test System


vogl has a shiny new tracing/replaying/trimming regression and smoke test system written by Mike Sartain that runs the following steps on a library of traces:
  • Plays back either an apitrace or a vogl trace, captures its output using the libvogltrace SO, and records the backbuffer CRC's (or per-component checksums on traces with multisampling) to a text file.
  • Plays back this trace and diffs the backbuffer CRC's vs. the CRC's seen during tracing.
  • Finally, we trim the test trace, then play back the trimmed trace and compare the backbuffer CRC's vs. the original trace's CRC's. Trimming involves playing back the test trace up to a predetermined point, capturing the entire GL state vector to memory and serializing it out, so we get a lot of good coverage in this step.
The system is located in the test directory of vogl's chroot repository, here. The script that runs the test is run_tests.sh. (This little script actually compiles and launches a small .C file that contains the entire test system.) The file tests.json configures which traces are tested and the parameters to the various test steps. 

Currently, only our smallest traces (from the g-truc 3.x suite) are pushed up to vogl_chroot. We also have many GB's of game traces (please drop me a message if you would like these traces). It's pretty easy to add your own traces - I'll be documenting how on vogl's wiki this afternoon.

Here are some shots of it in action on our dual Xeon (20 core/40 HW thread) test machine, using "/run_tests.sh -j 6" - to spawn up to 6 parallel processes at a time vs. the default 4:


Interestingly, the limiting scaling factor on this system seems to primarily be GPU video memory, not raw CPU or GPU performance. Metro Last Light, TF2, and DotA2 each can use ~1 GB of VRAM (and we only have a 3GB 780 Ti on this system). We don't try to order the trace replay order in any particular way to optimize overall throughput, which would be a nice addition.

vogl_src and vogl_chroot repos

Thanks to Carl Worth (Intel OTC) and Sir Anthony for submitting some patches to help us break up the previously huge vogl repo into two smaller repos. The primary one on github contains only the (buildable) source:

And vogl_chroot is the optional portion we use internally to simplify building and testing vogl:

You don't strictly need vogl_chroot, but beware you'll need to manually figure out the build dependencies if you don't. Building both 32-bit and 64-bit vogl without using the chroot approach can be a huge pain due to sometimes unresolvable/obscure i386 vs. amd64 system dependency issues. (If you disagree, I claim you haven't tried to actually do it. And no, gcc-multilib is not enough.)

Next Steps


We've been supplied with more test traces from various teams working on titles that will be released later this year on Steam Linux. (Hey - if you're working on a new GL game or port, feel free to send us more traces!) Also, Rad Game Tools just provided us with a fresh drop of Bink video, which now supports using compute shaders to massively accelerate video decoding. I'll be adding support for its GL 4.x callstream next week.

Replay Divergence Hell

$
0
0
We've had a handful of traces in vogl that don't replay correctly hanging around in our regression test suite. One g-truc sample (gl-320-fbo-blit) was randomly failing -- turns out it wasn't clearing the backbuffer every frame. It was rendering a checkerboard of quads, so half the pixels in the backbuffer were not being written. Sometimes it would play back seemingly correctly (black pixels where quads weren't being rendered), and sometimes we would see random-looking bits in there.

Anyhow, I'm now trying to figure out why the g-truc sample gl-330-blend-rtt diverges when replayed with vogl. It's also randomly failing. Beyond Compare's image comparison mode can be pretty helpful in cases like this.


Update: OK, I found the problem. The sample uses a FBO with 3 texture attachments, but it was only clearing the first one in display(). The fix is simple:

for (int i = 0; i < 3; i++)
  glClearBufferfv(GL_COLOR, i, &glm::vec4(1.0f)[0]);

Things that drive me nuts about OpenGL

$
0
0
Here's a brain dump of the things that sometimes drive me crazy about OpenGL. (Note these are strictly my own opinions, not those of Valve or my coworkers. I'm also in a ranty-type mood today after grappling with OpenGL for several years now..) My major motivation to posting this: the GL API needs a reboot because IMO Mantle/D3D12 are going to most likely eat it for lunch soon, so we should start talking and thinking about this stuff now.

Some are minor issues, and some are specific to tracing the API, but all these issues add up to API "friction" that sometimes make it difficult to encourage other devs to get into the GL API or ecosystem:

1. 20 years of legacy, needs a reboot and major simplification pass
Circle the wagons around a core-style API only with no compatibility mode cruft.
Simplify, KISS principle, "if in doubt throw it out"!
Mantle and D3D12 are going to thoroughly leave GL behind (again!) on the performance and developer "mindshare" axes very soon.
Global context state and the binding pattern sucks. The DSA (direct state access)-style API should be standard/required.

Some bitter medicine/tough love: Most devs will take the easy path and port their PS4/Xbone rendering code to D3D12/Mantle. They will not bother to re-write their entire rendering pipeline to use super-aggressive batching, etc. like the GL community has been recently recommending to get perf up. GL will be treated like a second-class citizen and porting target until the API is modernized and greatly simplified.

2. GL context creation hell:
Creating modern GL contexts can be hair raisingly and mind numbingly tricky and incredibly error prone ("trampoline" contexts anyone?). The process is so error prone, and platform (and occasionally even driver) specific that I would almost always recommend to never go directly to the glX, wgl, etc. API's, and instead always use a library such as SDL or GLFW (and something like GLEW to retrieve the function/extension pointers).

The de-facto requirement to always pick from a small set of large 3rd party libraries just to get a real context rolling sucks. The API should be simplified and standardized so using a 3rd party lib shouldn't be a requirement just to get a real context going.

3. The thread's current context may be an implied "this" pointer:
Function pointers returned by GetProcAddress() cannot (or should not - depending on the platform!) be used globally because they may be strongly tied to the context ("context-dependent" vs. "context-independent" in GL-speak). In other words, calling GetProcAddress() on one context and using the returned func pointer on another is either bad form or just crashes.
So is GL a C API or not?
Can we just simplify and standardize all this cruft?

4. glGet() API deficiencies:
This is probably too tracing specific, but it impacts regular devs indirectly because if the tools suck or are non-existent because the API is hard to trace your life as a developer will be harder.
The glGet() series of API's (glGetIntegerv, glGetTexImage, etc.) don't have a "max_size" parameter, so it's possible for the driver to overwrite the passed in buffer depending on the passed in parameters or even the global context state. These functions should accept a "max_size" parameter and the functions should fail if the supplied max_size is too small, not overwrite memory.
Computing the exact size of texture buffers the driver will read or write depends on various global context state - bad bad bad.
There are hundreds of possible glGet() pname enum's, some accepted by only some drivers. If you're writing a tracer or some sort of debug helper, there is no official way to determine how many values will be written by the driver given a specific pname enum. There are no official tables to determine if the indexed variants of glGet() can be used with a specified enum, or determine the optimal (lossless) type to use given a specific enum.
Also, the behavior of indexed vs. non-indexed gets & sets is not always clear to new users of the API.
Alternately, perhaps just add some glGet() metadeta API's vs. publishing tables.

5. glGetError()
There is no glSetLastError() API like Win32, making tracing needlessly complex.
Some apps never call it, some call it once per frame, some only call it while creating resources. Some call it thousands of times at init, and never again. I've seen major shipped GL apps with per-frame GL errors. (Is this normal? Does the developer even know?)

6. Can't query key things such as texture targets
(I know some of this is being worked on - thanks Cass!) This makes tracing/snapshotting more complex due to shadowing.
Shadowing deeply interacts with glGetError()'s (we can't update our shadow until we know the call succeeded, which involves a call to glGetError(), which absorbs the context's current GL error requiring even more fancy footwork to not diverge the traced app's view of GL errors).

About the recent talk of getting rid of all glGet()'s: IMO either all state should be queryable (which is almost the case today), or the API should be written with maximum perf and scalability in mind like D3D12/Mantle. The value added by the API is clearly understood in either of these extremes.
Getting rid of glGet()'s will make writing tracers & context snapshotters even trickier.

7. DSA (Direct State Access) API variants are still not standard and used/supported everywhere
DSA can make a huge difference to call overhead in some apps (such as Source1's GL backend). Just get rid of the reliance on global state, please, and make DSA standard for once and for all.

8. Official spec is still not complete in 2014:
The XML spec still lacks strongly typed param information everywhere. For example:

 <command>
    <proto>void <name>glBindVertexArray</name></proto>
    <param><ptype>GLuint</ptype> <name>array</name></param>
    <glx type="render" opcode="350"/>
  </command>

apitrace's glapi.py is still the only known public, reliable source of this information that I know of:

  GlFunction(Void, "glBindVertexArray", [(GLarray, "array")]),

Notice how glapi.py defines the type as "GLarray", while the official spec just has the nondescript "GLuint" type.

Add glGet info() to official spec: Mentioned above. How many values does the pname enum return? What are the optimal types to use to losslessly retrieve the driver's shadow of this state? Is the pname ok to use with the indexed variants?

9. GLSL version of the week hell:
For early versions, the GLSL version may not sync up with the GL version it was first defined in, making things even more needlessly confusing. And this is before you add in things like GLSL extensions (*not* GL extensions). Can be overwhelming to beginners.

10. No equivalent of standard/official D3DX lib+tools for GL:
Texture/pixel format conversion helpers that don't rely on using the driver or a GL context
KTX format interchange hell: The few tools that read/write the KTX format (GL's equivalent of DDS) can't always read/write eachother's files.
Devs just need the equivalent of Direct3D's DXTEX tool, with source.
The KTX examples just show how to load a KTX file into a GL texture. We need tools to convert KTX files to/from other standard formats, such as DDS, PNG, etc.
A GLSL compiler should be part of this lib (just like you can compile HLSL shaders with D3DX).

11. GL extensions are written as diffs vs the official spec
So if you're not a OpenGL Specification Expert it can be extremely difficult to understand some/many extensions.

Related: The official spec is written for too many audiences. Most consumers of the spec will not be experts in parsing it. The spec should be divided up into a developer-friendly spec vs a deeper spec for the driver writers. Extensions should not be pure delta's vs. the spec - who can really understand that?

12. Documentation hell
We've got 20 years of GL API cruft out there that adds noise to Google searching for GL API information, and beginners can get easily tripped up by bad/legacy documentation/examples.

13. MakeCurrent() hell
Can be extremely expensive, hidden extra variable cost with some extensions (I'm looking at you NV bindless texturing!), can crash drivers (or even the GPU!) if called within a glBegin/glEnd bracket, etc.
The behavior and performance of this call needs to be better specified and communicated to devs.

14. Drivers should not crash the GPU or CPU, or lock up when called in undefined ways via the API
Should be obvious by now. Please hire real testers and bang on your drivers!
Better yet: Structure the API to minimize the # of undefined or unsafe patterns that are even possible to express via the API.

15. Object deletion with multiple contexts, cross-context refcounting rules, "zombie" objects:
Good luck if the object being deleted is currently bound on another context.
Trying to call glGet()'s on a deleted object (that is still partially "live" because it's bound or attached somewhere) - behavior can differ between drivers.
All of this is needless overhead/complexity IMO.
Makes 100% reliable snapshotting and restoring GL context state very, very difficult.
I see world-class developers screw this up without knowing it, which is a clear sign that the API and/or tool ecosystem is broken.

16. Shader compiling/program linking hell
Major performance implications to shader compiling/linking.
Tokenized shader programs work. Direct3D is the existence proof that this approach works. The overall amount of pain GLSL has caused developers porting from D3D and end users (due to slow load times) is incredible, yet GL still only accepts textual GLSL shaders.
Performance drastically varies between drivers. Shader compiling can be effectively a no-op on some drivers, but extremely expensive on others.
Program linking can take *huge* amounts of time.
Some drivers cache linked programs, some don't.
Program linking time can be unpredictable: fast if the program is cached, but there's no way to query if the program is already cached or not. Also no way to query if the driver even supports caching.
Some drivers support threaded compilation, some don't. No way to query if the driver supports threaded compilation.
Some drivers just deadlock or have race conditions when you try to exploit threaded compilation.
Just a bad API, making it hard to trace and snapshot: Shaders can be detached after linking. Lots of linked program state is just not queryable at all, requiring link time shadowing by tracers.
Just copy & paste what D3D is doing (again, it works and devs understand it).

17. Difficult API to trace, replay, and snapshot/restore
Hurts tool ecosystem, ultimately impacts all users of API.
API should either be written to be easily traced/replayed/snapshotted, or incredibly performant/scalable like Mantle/D3D12. Right now GL has none of these properties, putting it in a bad spot from a value proposition perspective.
API authors should focus more on VALUE ADDED and less on how things should work, or how we are different from D3D because we're smarter.

18. Endless maze of GL functions (thousands of them!)
Hey - do we really need dozens of glVertexAttrib variants? Who really even uses this API?
API needs a reboot/simplification pass. Boost the "signal to noise" ratio, please.

19. Legacy complexities around v3.x API transition:
"Forward compatible", "compatibility" vs. "core" profiles etc. etc. etc.
Devs should not have to master this stuff to just use the API to render shaded triangles.
"Core" should not even be in the lexicon.

20. Reliably locking a buffer with DISCARD-semantics on all drivers without stalling the pipeline:
Do you use a map flag? BufferData() with NULL? Both, either, etc.?
What lock flag or flags do you use? Or does the driver just completely ignore the flag?
Trivial in D3D, difficult to do reliably in GL without being an expert or having direct access to driver developers.
This stuff is incredibly important!
Special note to driver developers: What separates the REAL driver devs from wannabees is how well you implement and test stuff like this. Pipeline stalling is not an option in 2014!

21. BufferSubData() stalls when called with "too much" data on threaded drivers
No way to query what "too much" data is. Is it 4k? 8k? 256k?

22. Pipeline stalling
No official (or any) way to get a callback or debug message when the driver decides to throw up its hands and insert a giant pipeline stall into your rendering thread
This can be the #1 source of rendering bottlenecks, yet we still have almost zero tools (or API's to help us build these tools) to track them down

23. Threaded drivers hell
Some manufacturers decide to forceably auto-enable their buggy multithreaded drivers months after titles have been shipped & thoroughly tested by the developer. (And to make matters worse, they do this without informing the developer of the "app profile" change or additions.)
Some multithreaded drivers have buggy glGet()'s when threading is enabled - makes snapshotting a nightmare.
No official way to query or control whether or not the driver will use multithreading.
No way to specify to the driver that a tracer is active which may issue a lot of glGet()'s (that the app would not normally do)
Bone headed threaded drivers that slow to an absolute crawl and stay there when an app or tracer constantly issues glGet()'s (just use a heuristic and automatically turn threading off!)

24. Timestamp queries can stall the pipeline on some drivers
Makes them useless for cross platform, reliable GPU profiling. GL spec should strongly define when the driver is allowed to stall on these queries. Unnecessary stalling should be redefined as a driver bug (by sometimes lazy/incompetent driver developers who don't understand how key these little API's can be).
For reference, NVidia does this stuff correctly. If you are a driver writer working on pipeline query code, please measure your implementation vs. NVidia's driver before bothering to release it.

25. GL is really X different API's (one per driver, sometimes per platform!) masquerading as a single API.
You can't/shouldn't ship a GL product until after you've thoroughly tested for correctness and performance on all drivers (in both threaded and non-threaded modes). You will be surprised at the driver differences. This came as a big shock to me after working for so long with D3D.
This indicates to me that Khronos needs to be more proactive at testing and validating the drivers. GL needs the equivalent of the WHQL process.

26. Extension hell
One of the touted advantages of GL is its support for extensions. I argue that extensions actually harm the API overall, not help it.

I've been through a large amount of major and minor GL callstreams (intricately!) over the previous ~1.5 years. (Before that I was the dev actually making togl work and be shippable on all the drivers. I can't even begin to communicate how difficult and stressful that process was 2+ years ago.) Excluding the driver devs I've probably worked with more real GL callstreams than most GL devs out there. Sadly, in many cases, some to many of the most advanced "modern" extensions barely work yet (and sometimes vendors will even admit this fact publicly). Or, if you try to use a cool-sounding extension you quickly discover that you're pushing a little-used (and tested) path down the driver and the thing is useless for all practical purposes.

From studying and working with the callstreams, it's apparent that devs do a massive MIN() operation across the functionality implemented on the available/targeted drivers. This typically means core profile v3.x, maybe also a 4.x backend with very simple/safe operations. (Or it's a small title that just uses compatiblity GL like it was still 1998 or 2003 - because that's all they need.) They don't bother with most extensions (especially the "modern" ones) because they either don't work reliably (because the driver paths that implement them are not tested on real apps at all - the classic chicken and egg problem), or they are only supported (sometimes barely) by 1 driver, or the value add just isn't there to justify expanding the product testing matrix even more.

Additionally, some of these modern extensions are very difficult to trace, which means that whatever debugging tools employed by the developer aren't compatible with them. So you need a fallback anyway, and if the devs must implement a fallback they might as well just ship the fallback (which works everywhere) and not worry about the extension (unless it adds a significant amount of value to the product).

So unless it's non-extended GL it might as well not be there to a large number of devs who just want to ship a reliable/working product.

The Truth on OpenGL Driver Quality

$
0
0
The driver landscape is something that any practicing GL dev must face unless you like having only a fraction of potential customers able to enjoy your product. (These are the drivers you'll have to work with in order to actually ship a product today or within the next year or so. If you're just a dev playing at home with one driver you'll probably not have to deal with any of this gritty real-world stuff.) 

If all you've ever done is use D3D then you better strap yourself in because the available GL drivers for Windows/Linux are all over the map. Here's my current opinion on driver quality:

Vendor A

What most devs use because this vendor has the most capable GL devs in the industry and the best testing process. It's the "standard" driver, it's pretty fast, and when given the choice this vendor's driver devs choose sanity (to make things work) vs. absolute GL spec purity. Devs playing at home use this driver because it has the sexiest, most fun to play with extensions and GL support. Most of what you hear about the amazing things GL will be able to do in order to compete against D3D12/Mantle are by devs playing with this driver. Unfortunately, we can't just target this driver or we miss out on large amounts of market share. 

Even so, until Source1 was ported to Linux and Valve devs totally held the hands of this driver's devs they couldn't even update a buffer (via a Map or BufferSubData) the D3D9/11-style way without it constantly stalling the pipeline. We're talking "driver perf 101" stuff here, so it's not without its historical faults. Also, when you hit a bug in this driver it tends to just fall flat on its face and either crash the GPU or (on Windows) TDR your system. Still, it's a very reliable/solid driver.

Vendor A supports a zillion extensions (some of them quite state of the art) that more or less work, but as soon as you start to use some of the most important ones you're off the driver's safe path and in a no man's land of crashing systems or TDR'ing at the slightest hickup.

This vendor's tools historically completely suck, or only work for some period of time and then stop working, or only work if you beg the tools team for direct assistance. They have enormous, perhaps Dilbert-esque tools teams that do who knows what. Of course, these tools only work (when they do work) on their driver.

This vendor is extremely savvy and strategic about embedding its devs directly into key game teams to make things happen. This is a double edged sword, because these devs will refuse to debug issues on other vendor's drivers, and they view GL only through the lens of how it's implemented by their driver. These embedded devs will purposely do things that they know are performant on their driver, with no idea how these things impact other drivers.

Historically, this vendor will do things like internally replace entire shaders for key titles to make them perform better (sometimes much better). Most drivers probably do stuff like this occasionally, but this vendor will stop at nothing for performance. What does this mean to the PC game industry or graphics devs? It means you, as "Joe Graphics Developer", have little chance of achieving the same technical feats in your title (even if you use the exact same algorithms!) because you don't have an embedded vendor driver engineer working specifically on your title making sure the driver does exactly the right thing (using low-level optimized shaders) when your specific game or engine is running. It also means that, historically, some of the PC graphics legends you know about aren't quite as smart or capable as history paints them to be, because they had a lot of help.

Vendor A is also jokingly known as the "Graphics Mafia". Be very careful if a dev from Vendor A gets embedded into your team. These guys are serious business.

Vendor B

A complete hodgepodge, inconsistent performance, very buggy, inconsistent regression testing, dysfunctional driver threading that is completely outside of the dev's official control. Unfortunately this vendor's GPU is pretty much standard and is quite capable hardware wise, so you can't ignore these guys even though as an organization they are idiots with software. Basic stuff like glTexStorage() crashes (on a shipped title) for months on end with this driver. B's driver devs try to follow the spec more closely than Vendor A, but in the end this tends to do them no good because most devs just use Vendor A's driver for development and when things don't work on Vendor B they blame the vendor, not the state of GL itself.

Vendor B driver's key extensions just don't work. They are play or paper extensions, put in there to pad resumes and show progress to managers. Major GL developers never use these extensions because they don't work. But they sound good on paper and show progress. Vendor B's extensions are a perfect demonstration of why GL extensions suck in practice.

This vendor can't get key stuff like queries or syncs to work reliably. So any extension that relies on syncs for CPU/GPU synchronization aren't workable. The driver devs remaining at this vendor pine to work at Vendor A. 

Vendor B can't update its driver without breaking something. They will send you updates or hotfixes that fix one thing but break two other things. If you single step into one of this driver's entrypoints you'll notice layers upon layers of cruft tacked on over the years by devs who are no longer at the company. Nobody remaining at vendor B understands these barnacle-like software layers enough to safely change them.

I've occasionally seen bizarre things happen on Vendor B's driver when replaying GL call streams of shipped titles into this driver using voglreplay. The game itself will work fine, but when the GL callstream is replayed we'll see massive framebuffer corruption (that goes away if we flush the GL pipeline after every draw). My guess: this driver is probably using app profiles to just turn off entire features that are just too buggy.

Interestingly, Vendor B has a tiny tools team that actually makes some pretty useful debugging tools that actually work much of the time - as long as you are using vendor B's GPU. Without Vendor B's tools togl and Source1 Linux would have taken much longer to ship.

This could be a temporary development, but Vendor B's driver seems to be on a downward trend on the reliability axis. (Yes, it can get worse!)

On the bright side, and believe it or not, Vendor B knows the OpenGL spec inside and out - to the syllable. If you can get them to assist you, their advice is more or less reasonable about plain GL matters (not extensions).

Vendor C - Driver #1

It's hard to ever genuinely get angry at Vendor C. They don't really want to do graphics, it's really just a distraction from their historically core business, but the trend is to integrate everything onto one die and they have plenty of die space to spare. They are masters at hardware, but at software they aren't all that interested really. They are the leaders in the open source graphics driver space, and their hardware specs are almost completely public. These folks actually have so much money and their org charts are so deep and wide they can afford two entirely different driver teams! (That's right - for this vendor, on one platform you get GL driver #1, and another you get GL driver #2, and they are completely different codebases and teams.)

Anyhow, this vendor's HR team is smart: it directly hires open source wiz kids to keep driver #1 plodding forward. This driver is the least advanced of the major drivers, but it more or less works as long as you don't understand or care what "FPS" means. If it doesn't work and you're really motivated you can git your hands dirty and try to fix it and submit a patch. If you're really good at fixing this driver and submitting patches then you may get a job offer from this vendor.

Anyhow, driver #1 is unfortunately pretty far behind on the GL standard, but maybe in 1-2 years they'll catch up and implement the spec as of last year. But you can't ignore this driver because they have a significant and strategically growing market share. So as a developer who wants to reach this market, you can't afford to use those fancy extensions or the latest trendy "modern" GL supported by vendors A and B. You must do a min() operation across all the drivers and in many cases this driver gates what you can do.

Vendor C has no GL tools at all for either platform. Sorry - want to debug that graphics problem you're having? Welcome to 1999.

Vendor C - Driver #2

A complete disaster. This team's driver is barely used by any titles because GL on this platform is totally a second class citizen, so many codepaths in there just don't work. They can't update a buffer without massive, random corruption. This team will do stuff like give you a different, unique, buggy driver drop for every title in your back catalog for perf analysis or testing. This team will honestly ask you if "perf" or "correctness" is more important.

I've seen one well-known engine team spend over a year attempting to get their latest GL 4.x+trendy extensions backend working at all on this team's driver. Hey guys - this driver just doesn't work, just move on already and implement a plain GL 3.x backend with workarounds (just like togl and other shipping titles do today).

On the bright side, Vendor C feeds this driver team more internal information about their hardware than the other team. So it tends to be a few percent faster than driver #1 on the same title/hardware - when it works at all.

Other drivers:

In addition to the above major drivers, there are several open source drivers, mostly developed by the community, for hardware from vendors A and B. They tend to be behind the times from a GL perspective, but I hear they mostly work. I don't have any real experience or hard data with these drivers, because I've been fearful that working with these open source/reverse engineered drivers would have pissed off each vendor's closed source teams so much that they wouldn't help.

Vendor A hates these drivers because they are deeply entrenched in the current way things are done. These devs have things like mortgages and college funds (or whatever) to keep funding, so there's a massive amount of inertia from this camp. There's no way they are going to release their Top Secret GPU Specs to the public, or (gasp!) open source their driver. Vendor A will have to jump on the open source driver bandwagon soon in order to better compete against Vendor C's open model, whether they like it or not.

Vendor B halfheartedly helps their open source driver by funding a tiny team to keep the thing working. At some point, the open source driver for Vendor B's GPU may be a more viable path forward then their half-functional closed source driver.

Conclusion

To ship a major GL title you'll need to test your code on each driver and work around all the problems. May the "GL Gods" help you if you experience random GPU corruption, heap corruption, lockups, or TDR's. Be very nice to the driver teams and their managers/execs, because without them your chances aren't nearly as good.


Apple Metal API

"OpenGL Is Broken"

How I learned to stop worrying and love OpenGL

$
0
0
Good summary of the OpenGL developer debate with links:

http://www.dayonepatch.com/index.php?/topic/107633-a-pretty-huge-debate-about-opengl-has-erupted-in-the-dev-community-involving-devs-from-valve-epic-firaxis-and-amd/

"This is quite technical, but I think this is very interesting considering what Valve is staking on OpenGL in regard to its future plans:

1. The debate started when Rich Geldreich from Valve (who is working on Vogl, Valve's OpenGL debugger) posted an entry on his blog called Things That Drive Me Nuts About OpenGL.  He also made a couple of Twitter posts here and here.

2. In response, Timothy Lottes, a senior rendering programmer at Epic who developed FXAA and TXAA while at Nvidia, posted this response on his personal blog.

3. Rick Geldreich the posted The Truth on OpenGL Driver Quality on his blog.  His Twitter post on this entry features quite a few responses.

4. Joshua Barczak, Firaxis's lead graphics engineer for the Civilization, agrees with Geldreich and posted this blog entry OpenGL Is Broken.

5. Epic's Timothy Lottes (as naturally expected) posted this response.

6. This caused AMD's OpenGL developer to post an angry tweet and another one from a former Nvidia developer who now works at Valve.

7.  Michael Marks, the tech director from Aspyr, shared his thoughts.  He also posted OpenGL Stop Breaking My Heart and The Impact of Apple's Limited OpenGL Support On Gaming.

8.  A Unity developer chimed in with Rant About Rants About OpenGL.

9.  Barczak posted a follow-up regarding OpenGL driver quality.

10.  Lastly, and somewhat unrelated, a Naughty Dog dev said LOL DX12 LOL."


Viewing all 302 articles
Browse latest View live