Quantcast
Channel: Richard Geldreich's Blog
Viewing all 302 articles
Browse latest View live

LZHAM v1.0 vs. LZMA decomp. perf on a large corpus of files

$
0
0
LZHAM isn't always faster than LZMA. LZHAM has a more expensive startup cost (which I've reduced a bunch since the alpha but it's still there), and it must update several large Huffman tables at periodic intervals. The previous alpha versions had way too many Huff tables, which really dragged the codec down on some files. The new version now only has a handful of tables, I've reduced the default table update interval, and you can now fine tune the update interval. This graph was generated at update speed 20 (least # of updates/fastest).

To visualize where LZHAM is faster or slower, I ran a test app on a corpus of 21,702 files, all >= 1024 bytes (to reduce the sheer number of them) and timed how long LZHAM vs. LZMA took to decompress each file. This is a mix of game assets from various titles, the usual standard corpus files (calgary etc.), XML/JSON/binary JSON/source files, random WAV/BMP/TGA/JPG/MP3's, executables+DLL's from popular installs, etc. Just random stuff.

I tossed any results where LZMA expanded the data because in these cases LZMA is up to ~60x slower than LZHAM. LZHAM has special handling for uncompressed data, and LZMA does not, so it just bogs down really badly in these cases. There are still many cases in this graph where LZMA just bogs down terribly on nearly uncompressible files, LZHAM can win massively in this case because it chooses which 512k blocks to store uncompressed.


Here's the resulting graph showing LZMA's vs. LZHAM's decompression time on a 3.3 GHz Core i7, sorted by the LZMA's compressed file size. The blue line is the speedup, where less than 1.0 means LZMA was faster, and greater than 1.0 means LZHAM was faster. 

The red line is the compressed file size on a log scale. This corpus has a ton of small (<4kb) files.

This graph shows than LZHAM v1.0 is pretty much always slower than LZMA if the compressed file size is <= ~2400 bytes. LZHAM can be only ~20% as fast in these cases. At around ~13k LZHAM is usually faster, and the greater the amount of compressed data the higher the likelihood that LZHAM is faster. You can estimate the threshold amount of original/source data if you know your data's average compression ratio.

Basically, LZHAM sucks on small blocks. I can make this somewhat better by reducing the startup cost, and optionally allowing the user to disable the huff table updating (or just slow it down even more). Another alternative is to have the compressor intelligently break up the input stream into a handful (or just 2) carefully chosen LZHAM blocks and issue a "update all huff tables now" command to the decompressor in between the block boundaries.

Note all of my timings include the time LZHAM takes to allocate its work memory and initialize its internal data structures. The dictionary size for LZHAM was always 64MB in this test, while the dict. size for LZMA was tuned to be the first pow2 >= the source file size, so it's possible LZHAM is at a bit of a disadvantage here due to extra memory allocation costs relative to LZMA. I'm running another test (in LZHAM's unbuffered mode) to find out if this makes any difference.

(Thanks to John Brooks for giving me some feedback on this graph.)

Update: Here's a new, less noisy graph with the following differences:
- Filtered out all files with a LZMA comp ratio less than 2% (because we know LZMA totally sucks at these low ratios)
- Switched LZHAM into unbuffered mode, for a minor decompression speed boost.


First LZHAM iOS stats with Unity asset bundle data

$
0
0
Got everything (both the compressor and decompressor) working. Was surprisingly easy. Had 1 misaligned load to deal with in the compressor's match finder because of a #ifdef problem.

I combined together 3 of our larger Unity asset bundles together into a single .TAR file and here are the current results on my iPhone 4 (800 MHz A4 CPU - 512MB RAM):

LZHAM Compressed from 15209984 to 4999552 bytes
LZHAM Comp time: 112.771710, BPS: 134874.110168
LZHAM Decomp time: 0.895846, BPS: 16978346.767638

For compression, I used a 16MB dictionary, highest compression (level 4) with normal parsing. Compression is slow, but LZHAM is designed for offline use so as long as it works at all I'm not sweating it for now.

Decompression is around 47 cycles per byte on these bundles files, which contain a variety of Unity asset data.

Now LZMA stats (level 9 16MB dictionary, default tuning options):

LZMA compressed from 15209984 to 4726211 bytes
LZMA Comp time: 41.805776, BPS: 363824.942238
LZMA Decomp time: 1.993880, BPS: 7628334.723455

LZMA decompression was ~105 cycles/byte.

So LZHAM decompresses this data 2.2x faster. Its ratio is slightly lower, but this can be somewhat compensated for by enabling LZHAM's better parser and compressing offline (with a multicore desktop CPU). This helps a little: 4960935 bytes. By using more frequent Huff table updates (level 3 vs. the default 8) and extreme parsing, I get 4942383 compressed bytes, but decompression is ~18% slower. I'm going to graph all of this data next.

For reference, my iPhone 4's CPU is ~13.6x slower for compression and ~8.5x slower for decompression vs. my Core i7 3.3 GHz desktop CPU (comparing absolute wall time, no multithreading, same settings and file data, etc.).

Update: Here are the testing results after compressing & decompressing all of our uncompressed asset bundles on my iPhone 4. I limited LZHAM's compressor to a dictionary size of 8MB, less frequent table updating (table update speed of 12 vs the default 8), and normal parsing, which limited its ratio a bit vs. running it on desktop.

LZHAM is slower on a few files totaling ~.2% of the data (~320k out of 172MB), from there it rises to between 1.8x-4.8x faster. (Note I'm currently regenerating this graph so LZHAM's dictionary size matches LZMA's.)

1. Red=Speedup, Blue=LZMA compressed size, sorted by compressed size.


2. Red: Speedup, Blue: LZMA_comp_size/LZHAM_comp_size, sorted by speedup.


LZHAM v1.0 vs. LZMA decompression perf. on iPhone 6+

$
0
0
I borrowed a coworker's iPhone 6+ and reran my bundle compression benchmarking app. According to wikipedia, it's a 1.4 GHz dual-core ARMv8-A.

LZHAM is 2.3x-9x faster on this device, unless the bundle's compressed size is < 1000 bytes. The comp size threshold where LZHAM is faster is lower than what I'm used to seeing, not sure exactly why yet.

1. Bundles sorted by LZHAM vs. LZMA decompression speedup (slowest on left):


2. Bundles sorted by LZMA compressed size (smallest on left), with relative decompression speedup in blue:


LZHAM v1.0 is being tested on iOS/OSX/Linux/Win

$
0
0
Currently testing it on a few machines using random codec settings with ~3.5 million files. We also just switched over our title's bundle decompression step from LZMA to LZHAM, so the decompressor will be tested on many iOS devices too.

I've also tested the compression portion of the code on iOS, but I won't be able to get much coverage there before releasing it. Honestly the decompressor is much more interesting for mobile devices (that's really the whole point of LZHAM).

I'll be porting and testing LZHAM on Android within a week or so - should be easy by this point.

Windows 10: An Arrow Aimed Straight at Steam

$
0
0
I find this very interesting news, and if you're not paying attention you should:

Phoronix: Windows 10 To Be A Free Upgrade: What Linux Users Need To Know

PC World: Windows 10's new features: Cortana, a 'Spartan' browser, Xbox streaming, and more

Rock, Paper, Shotgun: Is Windows 10 Good For PC Gamers Or XBone Owners?

I think Microsoft's strategy here is surprisingly well thought out. Their execs finally figured out "to know your enemy you must become your enemy". Windows 10 is free, has a new state of the art graphics API (DirectX v12) created by the best graphics specialists, real software engineers, and real testers in the business, awesome developer tools (Visual Studio) that actually work with real CPU/GPU debugging and profiling support all built in, all of your existing apps and games still work, and they're pulling out all the stops with the Halo/Xbox branding right down into the OS and browser.

They just need to make the Windows 10 App Store not suck: Continue to use their Xbox brand as a lever, carefully feed and nourish the ecosystem, listen to their customers, and undercut the living hell out of Steam. Steam itself started out as a total pile of crap, but they listened to their customers, fixed the problems over time, gave their customers good deals and shipped apps you couldn't get anywhere else at the right prices, and built and nourished the community. Microsoft can do all the same things, and perhaps they've finally figured this out.

It's now all down to execution, recovering from some obviously bone headed moves (sometimes fueled by excessive Redmond Kool-Aid drinking, like the botched Windows 8 UI and no Start Menu disasters), recognizing and quickly recovering from the inevitable new bone headed moves, and sustaining the effort over the long term (something Microsoft has definitely not been very good at except for their core brands). Competition is great.

LZHAM v1.0 released on github

LZHAM 1.0 integrated into 7zip command line and GUI

$
0
0
I integrated the LZHAM codec into the awesome open source 7zip archiver a few years ago for testing purposes, but I was hesitant to release it because I was still frequently changing LZHAM's bitstream. The bitstream is now locked, so here it is in case anyone else out there finds it useful.

Here's the full source code and prebuilt Windows x86 binaries in the "bin" directory:
http://www.tenacioussoftware.com/7zipsrc_release_lzham_1_0.7z

Note I haven't updated the makefiles yet, just the VS 2008 project files. This has only been tested by me, and I'm not an expert on the very large 7zip codebase (so buyer beware). I did most of this work several years ago, so this is undoubtedly an outdated version of 7zip.
I've only been able to compile the 32-bit version of 7zip so far, so the max. dictionary size is limited to 64MB. (Important note: I'm not trying to fork or break 7zip in any way, this is *only* for testing and fooling around and any archives it makes in LZHAM mode shouldn't be distributed.)

I'll be merging my changes over into the latest version of 7zip, probably next weekend. Also, LZHAM is statically linked in at the moment, I'll be changing this to load LZHAM as a DLL.

Here are some example command line usages (you can also select LZHAM in the GUI too). The method may range from 1-9, just like LZMA, and internally it's converted to the following LZHAM settings. You can use the "-md=16M" or "-md=128K" option to override the dictionary size. The -mmt=on/off option controls threading, which is on by default (i.e. -mmt=on or -mmt=off), and this new option controls deterministic parsing (which defaults to *off*): -mz=on

-mx=X:
7z method 1: LZHAM method 0, dict size 2^20
7z method 2: LZHAM method 1, dict size 2^21
7z methods 3-4: LZHAM method 2, dict size 2^22
7z methods 5-6: LZHAM method 3, dict size 2^23
7z methods 7-8: LZHAM method 4, dict size 2^26
7z methods 9: LZHAM method 4 extreme parsing, dict size 2^26 (can be very slow!)

In practice, beware using anything more than -mx=8 ("Maximum" in the GUI) unless you have a very powerful machine and some patience. Also, unless you're on a Core i7 or Xeon LZHAM's compressor will seem very slow to you, because the compressor is totally hamstrung on single core CPU's. (LZHAM is focused on decompression speed combined with very high ratios, so compression speed totally takes back seat.)

Example usage:

E:\dev\lzham\7zipsrc\bin>7z -m0=LZHAM -mx=9 a temp *.dll

7-Zip 9.20 (LZHAM v1.0) Copyright (c) 1999-2010 Igor Pavlov 2010-11-18
Scanning

Creating archive temp.7z

Compressing 7z.dll

Everything is Ok

E:\dev\lzham\7zipsrc\bin>7z -slt l temp2.7z

7-Zip 9.20 (LZHAM v1.0) Copyright (c) 1999-2010 Igor Pavlov 2010-11-18

Listing archive: temp2.7z

--
Path = temp2.7z
Type = 7z
Method = LZHAM BCJ
Solid = -
Blocks = 1
Physical Size = 487287
Headers Size = 122

----------
Path = 7z.dll
Size = 1268736
Packed Size = 487165
Modified = 2015-01-31 01:13:33
Attributes = ....A
CRC = 000E5D5E
Encrypted = -
Method = BCJ LZHAM:[1017030000]
Block = 0

7zip GUI:


7zip 9.38 custom codec plugin for LZHAM 1.0

$
0
0
Igor Pavlov and the devs at encode.ru gave me some pointers on how to create a custom 7z codec DLL. Here's the first 32-bit build of the 7zip custom codec plugin DLL, compatible with 7zip 9.38 beta x86 (note I've updated this with 1 decompressor bugfix since the first release a couple days ago):

http://www.tenacioussoftware.com/7z_lzhamcodec_test3.7z

http://www.tenacioussoftware.com/7z_...c_test3_src.7z

To use this: install 9.38 beta (I got it from http://sourceforge.net/projects/seve...es/7-Zip/9.38/), manually create a subdirectory named "Codecs" in your install directory (i.e. "C:\Program Files (x86)\7-Zip\Codecs"), and extract LzhamCodec.DLL into this directory. If you run "7z i" you should see this:

Codecs:
Lib ID Name
0 C 303011B BCJ2
0 C 3030103 BCJ
0 C 3030205 PPC
...
0 C 30401 PPMD
0 40301 Rar1
0 40302 Rar2
0 40303 Rar3
0 C 6F10701 7zAES
0 C 6F00181 AES256CBC1 C 90101 LZHAM

The ID used in this DLL (90101) may change - I'm working this out with Igor.

This version's command line parameters are similar to 7z-lzham 9.20:

-mx=[0,9] - Controls LZHAM compression level, dictionary size, and extreme parsing. -mx=9 enables the best of 4 ("extreme" parser), which can be very slow.

Details:
-mx0=lzham_level:0, dict_size_log2:18
1=0,20 (fastest)
2=1,21
3=2,21
4=2,22
5=3,22
6=3,23
7=4,25
8=4,26 (slowest - the default)
9=4,26 best of 4 parsing (even slower)

-mt=on/off or integer - Controls threading (default=on)

-ma=[0,1] - Deterministic parsing. 1=on (default=off)

-md=64K, etc. - Override dictionary size. If you don't set this the dictionary size is inferred via the -mx=# parameter setting.

Example usage:

7z -m0=LZHAM -mx=8 a temp *.dll

To use LZHAM from the GUI, you can put custom parameters on the command line (without -m prefixes), i.e.: "0=bcj 1=lzham x=8". (I think you can only specify algorithm and level options here.) Note if you set the Compression Level pulldown to "Ultra" LZHAM will use best of 4 (extreme) parsing and be pretty slow, so the highest you probably want to use is "Maximum":


Upcoming LZHAM decompressor optimizations

$
0
0
All of these changes are on github:

Over the previous week I've increased the decompressor's average speed by roughly 1.5%-2%, by enabling Huffman decoding acceleration tables on the distance LSB symbol table.

I'm currently testing several changes which decrease the time it takes for the decompressor to initialize, and increases avg. throughput on tiny (<10KB) streams:

  • The initial set of Huffman tables are very simple because the symbol frequencies are all 1's. The decompressor now quickly detects this case and bypasses the more general canonical Huffman codesize computation step.
  • The decompressor bypasses the construction of Huffman decoding acceleration tables near the beginning of the stream. It computes the approx. cost of constructing the accel. tables and decoding the next X symbols using those tables, verses just decoding the next X symbols without accel. tables, and chooses whatever is predicted to be cheapest. The Huff decode acceleration tables can be rather big (up to 2048 entries), so this is only a win at the beginning of streams (when the tables are rapidly updated).

x86 timing results on a 64 byte test file (file to file decompression, 64MB dictionary):

Before:
Total time including init, I/O, decompression: .146ms
Decompression only time: .040ms

After:
Total time including init, I/O, decompression: .120ms
Decompression only time: .020ms

x86 timing results on a 3087 byte test file:

Before:
Total: .269ms
Decomp only: .170ms

After:
Total: .230ms
Decomp only: .132ms

These optimizations should significantly reduce the time it takes to reinit() and restart decompression (hopefully around 30-50%). I'm going to profile the decompressor over the time it takes to startup and decode the first few KB next.


More LZHAM small block optimizations

$
0
0
Improved tiny block performance (i.e. calling lzham_decompress_memory() on a 88 byte string) by 3.3x by profiling the decompression of 400k blocks and focusing on the hotspots.

The top bottleneck was related to initializing the default Huffman tables, as I expected. At decomp startup, all the symbols have a frequency of 1, and the min/max code sizes are either equal (if the table's num_syms==pow2) or only differ by 1 (for non-pow2 tables). So this case was easy to optimize throughout the Huffman decoder table construction code.

The next major bottleneck were some calls to malloc()/free() (up to a total of 34K worth, excluding the dictionary when using unbuffered decompression). I fixed this by adding a malloc_context parameter to any object or container that allocated/freed memory (which was a big pain), then allowing the user to optionally specify a fixed-size memory arena when they create the malloc context. The allocator functions in lzham_mem.cpp then try to allocate from this arena, which just treats it as a simple stack. Only the decompressor uses an arena, because its allocation patterns are very simple.

I won't be pushing these changes up until a lot more testing. I should probably make a branch.

A Telemetry-style visualization of LZHAM v1.1's multithreaded compressor

$
0
0
I'm a big fan of Rad's Telemetry profiler, which I used at Valve for various Linux profiling tasks, but it's unfortunately out of reach to independent developers. So I'm just making my own mini version of Telemetry, using imgui for the UI. For most uses Telemetry itself is actually overkill anyway. I may open source this if I can find the time to polish it more.

I've optimized LZHAM v1.1's compressor for more efficient multithreading vs. v1.0, but it's still doesn't scale quite as much as I was hoping. Average utilization on Core i7 Gulftown (6 cores) is only around 50-75%. Previously, the main thread would wait for all parsing jobs to complete before coding, v1.1 can now overlap parsing and coding. I also optimized the match finder so it initializes more quickly at the beginning of each block, and the finder jobs are a little faster.

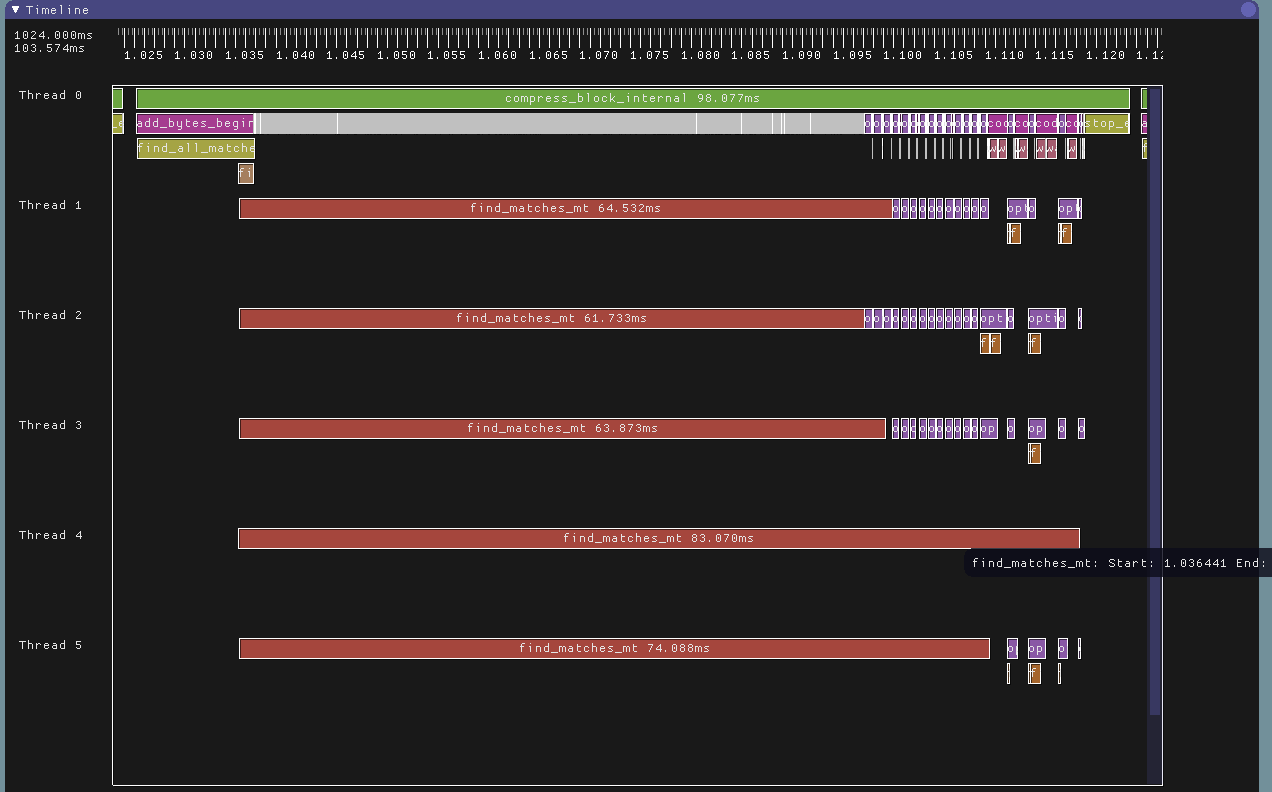
Here are the results on LZHAM v1.1 (currently on github here), limited to 6 total threads, after a few hours of messing around learning imgui. Not all the time in compress_block_internal() has been marked up for profiling, but it's a start:


Thread 0 is the main thread, while threads 1-5 are controlled by the task pool. The flow of time is from left to right, and this view visualizes approx. 616.4ms.

At the beginning of a block, the compressor allocated 5 total threads for match finding and 2 total threads for parsing.

The major operations:

- Thread 0 (the caller's thread) controls everything. compress_block_internal() is where each 512KB block is compressed. find_all_matches() prepares the data structures used by the parallel match finder, kicks off a bunch of find_matches_mt() tasks to find matches for the entire block, then it finds all the nearest len2 matches for the entire block. After this is done it begins parsing (which can be done in parallel) and coding (which must be done serially).

The main thread proceeds to process the 512KB input block in groups of (typically) 3KB "parse chunks". Several 3KB chunks can be parsed in parallel within a single group, but all work within a group must finish before proceeding to the next group.

- Coding is always done by thread 0.

Thread 0 waits for each chunk in a group to be parsed before it codes the results. Coding must proceed sequentially, which is why it's on thread 0. The first chunk in a group is always parsed on thread 0, while the other chunks in the group may be parsed using jobs on the thread pool. The parse group size is dynamically increased as the match finders finish up in order to keep the thread pool's utilization high.

- Threads 1-5 are controlled by the thread pool. In LZHAM v1.1, there are only two task types: match finding, and parsing. The parsers consume the match finder's output, and the main thread consumes the parser's output. Coding is downstream of everything.

The match finders may sometimes spin and then sleep if they get too far ahead of the finders, which happens more than I would like (match finding is usually the bottleneck). This can cause the main thread to stall as it tries to code each chunk in a group.

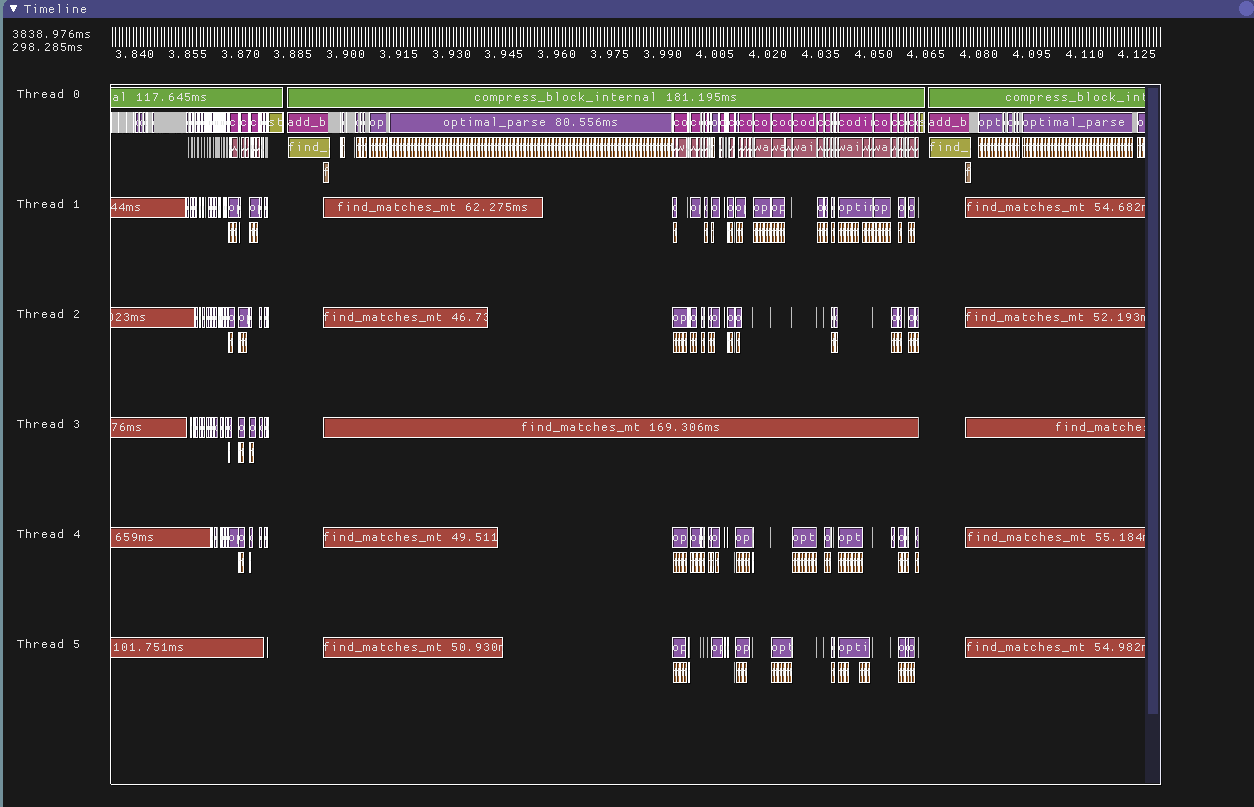
Here's a zoom in of the above graph, showing the parsers having to wait in various places:


Some of the issues I can see with LZHAM v1.1's multithreading:
- find_all_matches() is single threaded, and the world stops until this function finishes, limiting parallelization.
- find_len2_matches() should be a task.
- It's not visualized here, but the adler32() call (done once per block) can also be a task. Currently, it's done once on thread 0 after the finder tasks are kicked off.
- The finder tasks should take roughly the same amount of time to execute, but it's clear that the finder job on thread 4 took much longer than the others.

Here's an example of a very unbalanced situation on thread 3. These long finder tasks need to be split up into much smaller tasks.


- There's some serial work in stop_encoding(), which takes around 5ms. This function interleaves the arithmetic and Huffman codes into a single output bitstream.

v1.1 is basically ready, I just need to push it to the main github repo. I'm going to refine the profiler and then use it to tune LZHAM v1.1's multithreading more.

Graphing Heap Memory Allocations

$
0
0
We've instrumented the version of Mono that Unity v4.6 uses so it can create a full heap transaction log, as well as full heap memory snapshots after all GC's. With this data we can build complete graphs of all objects on the Mono heap, either going "down" starting from the static roots, or "up" from a single object. Note this heap visualization method is relevant to C/C++ too, because at its core this version of Mono actually uses the Boehm Collector for C/C++.

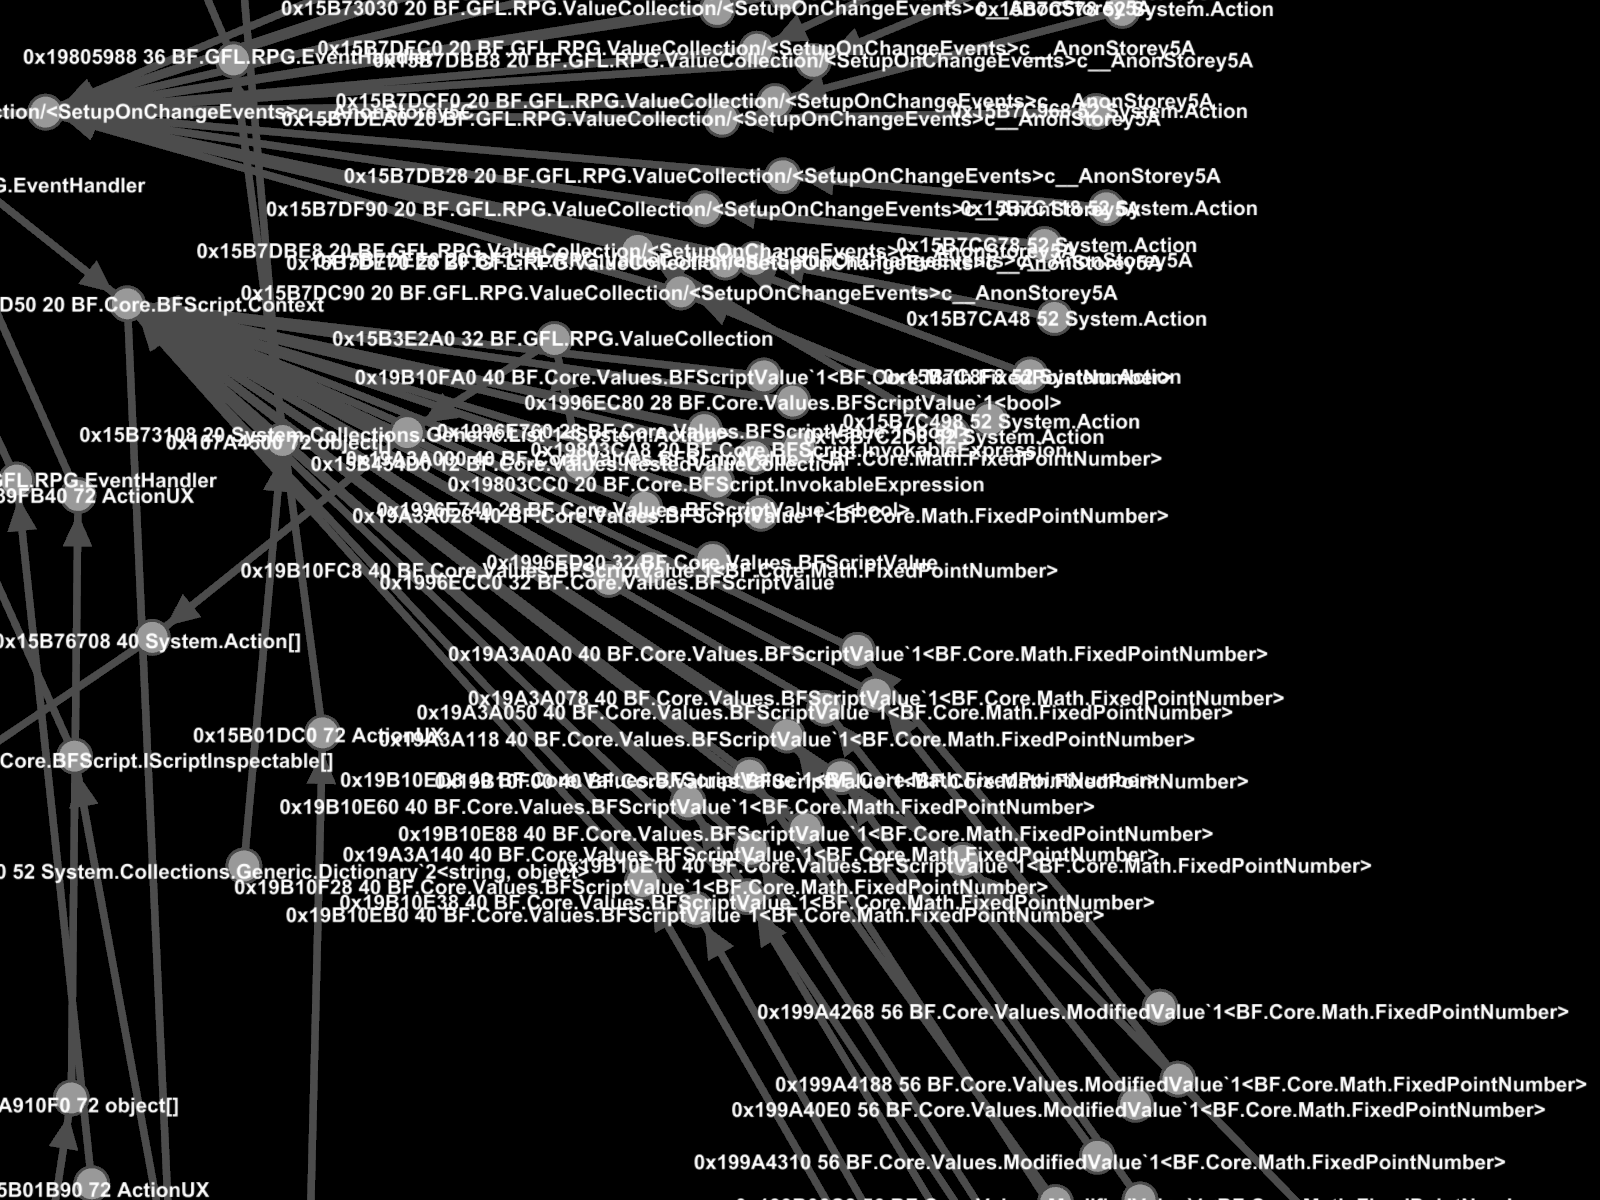
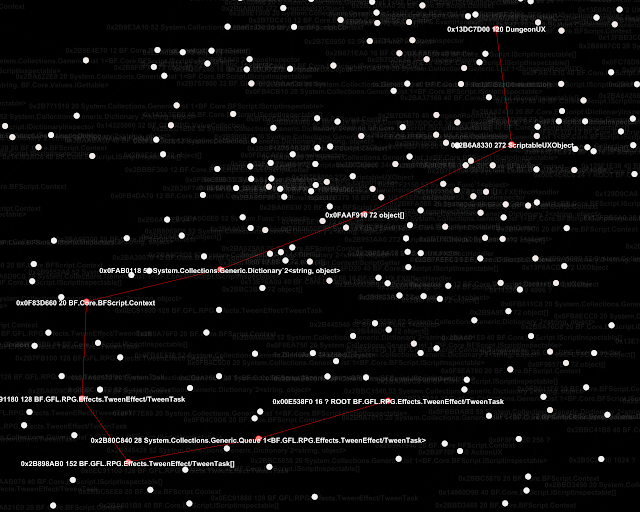
To build this graph, we recorded a heap transaction log and post-GC memory snapshots of our product running a single dungeon and exiting to the game's menu. I then played back this transaction log with our analysis tool ("HeapBoss") and stopped playing back the log right after the dungeon was exited. I had the tool start building the graph at a single ScriptableUXObject object on the heap (instances of this type are leaking after each dungeon). The tool then found all references to this object recursively, up to any roots and exported the graph to a .dot file. Gephi is used to visualize the graph, using the Yifan Hu algorithm to optimize the layout.

Using this visualization method we quickly determined why these objects are leaking, which was easy once we could visualize the chain of references in various containers back up to the UXManager.


LZHAM v1.0 is back on the Pareto frontier for decompression speed

Garbage collected systems must have good tools

$
0
0
Hey game engine developers: Please don't release garbage collected systems without solid tools.

We need the ability to take full heap snapshots, visualize allocation graphs, do shortest path analysis from roots to individual objects, etc. If you don't provide tools like this then it can be extremely painful to ship reliable large scale software that uses garbage collection.


Industrial strength Mono memory analysis tools for large scale Unity games

$
0
0
We've been investing a bunch of time into creating a set of Mono (C#) memory leak and performance analysis tools, which we've been using to help us ship our first title (Dungeon Boss). Here's a high-level description of how the tools work and what we can currently do with them:

First, we have a custom instrumented version of mono.dll that captures and records a full transaction log of all mono and lower level libgc (Boehm collector) heap activity. It records to the log almost all internal malloc's/free's, mono allocs, and which mono allocs are collected during each GC. A full backtrace is stored with each log record.

We also record full RAM dumps at each GC, as well as the location of all static roots, thread stacks, etc. (The full RAM dumps may seem excessive, but they are extremely compressible with LZ4 and are key to understanding the relationships between allocations.)

We've also instrumented our game to record custom events to the log file: At menu, level start/end, encounter start, start of Update(), etc. 

A typical workflow is to run the game in a Windows standalone build using our instrumented version of mono.dll, which generates a large binary transaction log. We then post process this log using a C# tool named "HeapBoss", which spews out a huge .JSON file and a number of binary heap RAM snapshots. We then explore and continue processing all this data using an interactive C++ command line tool named "HeapMan".

Here's a list of things we can currently do once we have a heap transaction log and GC RAM snapshots:

- Log exploration and statistical analysis:
Dump the log command index of all GC's, the ID's of all custom events, dump all allocs or GC frees of a specific type, etc.

- Blame list construction: We can replay the transaction log up to a specific GC, then recreate the state of the mono heap at that particular GC. We can then construct a "blame list" of those C# functions which are responsible for each allocation. We use a manually created leaf function name exclusion list (consisting of about 50 regex patterns) to exclude the deepest functions from each backtrace which are too low level (or internal) to be interesting or useful for blame list construction. 

This method is useful for getting a picture of the top consumers of Mono heap memory at a specific spot in the game. We output this list to a .CSV file.

- Growth over time ("leak") analysis: We replay the transaction log up to spot A, create a heap state object, then continue playing up to spot B and create another heap state object. We then construct a blame list for each state object, diff them, then record the results to a .CSV file.

This allows us to see which functions have grown or shrunk their allocations over time. We've found many leaks this way. (Of course, they aren't leaks in the C/C++ sense. In C#, it's easy to construct systems which have degenerate memory behavior over time.)

- Various queries: Find all heap objects of type X. Find all objects on the heap which potentially have a pointer to a specific object (or address). Examine an object's memory at a specific GC and determine which objects it may potentially point to. Find the allocation that includes address X, if any. Find the vtable at address X, etc.

Note our tools don't know where the pointers are really located in a type, so when we examine the raw memory of an object instance it's possible to mistake some random bits for a valid object pointer. We do our best to exclude pointers which aren't aligned, or don't point to the beginning of another allocated object, etc. In practice this approach is surprisingly reliable.

- Root analysis to help find unintended leaks: Given an object, recursively find all objects which reference it, then find all the objects which refer to those objects, etc. until you discover all the roots which directly or indirectly refer to the specific objects. Output the results as a .DOT file and import into gephi for visualization and deeper analysis. (graphviz is another option, but it doesn't scale to large graphs as well as gephi.)

- Heap transaction videos: Create a PNG image visualizing the active heap allocations and synchronize this video with the game. Helps to better understand how the title is utilizing/abusing heap memory at different spots during gameplay.

What we'll be doing next:

- "Churn" analysis: Create a histogram of the blame function for each GC free, sort by the # of frees or # of bytes freed to identify those functions which are creating the most garbage over time.

- Automatically identify the parts of the heap graph that always grow over time. Right now, we do this manually by first doing a growth analysis, then finding which types are responsible for the growth, then finding the instance(s) which grow over time.


Dungeon Boss's current memory footprint on iOS

$
0
0
A snapshot of our current memory footprint on iOS, using Unity's built-in memory profiling tool (thanks to Sean Cooper):

Mono       59
Unity      53
GfxDriver  34.4
Textures   29.4
Animations 23.8
Meshes     16.8
FMOD       13
Profiler   12.8
Audio      11.1


Mono heap's allocator is a greedy SOB, and in practice only around 40-50% of its allocated memory contains persistent C# objects. We are going to try tweaking or modifying it soon to be less greedy, because we need the memory.

Also, the Unity heap is relatively huge now so we're going to poke around in there and see what's going in.

LZHAM decompressor optimization ideas

$
0
0
John Brooks (CEO of Blue Shift Inc.) and I were discussing LZHAM's current decompression performance vs. Google's Brotli codec and we came up with these ideas:

- Basic block optimization:
The current decompressor's inner loop is a general purpose coroutine based design, so a single implementation can handle both streaming and non-streaming scenarios. This is hurting perf. because the coroutine structure consists of a huge switch statement, which causes the compiler to dump locals to registers (and read them back in) a lot.

I'm going to add an alternative non-coroutine version of the inner loop that won't support streaming to optimize the very common memory to memory scenario. (LZHAM already has a few non-streaming optimizations in there, but it still uses a huge switch statement that breaks up the inner loop into tons of basic blocks.)

- LZHAM doesn't have any SIMD optimizations in its Huffman routines. I've been hesitant to use SIMD code anywhere in LZHAM because it complicates testing, but some of the Huffman routines should be easy to optimize with SIMD code.

- Finally, LZHAM's small block performance suffers vs. LZMA, Brotli, or zlib because it must compute Huffman tables on the fly at a fairly high frequency near the beginning of streams. There's a simple solution to this, which is to use precomputed Huffman table codelengths at the start of streams, then switch to dynamically updated Huffman tables once it makes sense to do so.

I already have the code to do this stuff (from the original LZHAM prototype), but it would require breaking v1.0 format compatibility. (And I'm not going to break format compatibility - if/when I do the new thing will have a different name.)


The great github migration

$
0
0
I've just migrated most of my projects from the sinking ship that is Google Code, but the wikis and readme.md files aren't setup yet:

https://github.com/richgel999/rg-etc1
https://github.com/richgel999/fxdis-d3d1x
https://github.com/richgel999/crunch
https://github.com/richgel999/picojpeg
https://github.com/richgel999/imageresampler
https://github.com/richgel999/miniz
https://github.com/richgel999/jpeg-compressor

The wiki data was auto-migrated into the "wiki" branch.

I haven't migrated LZHAM alpha (used by Planetside 2) yet. Still deciding if I should just archive it somewhere instead because it's a dead branch (LZHAM now lives here, and the much faster compressing development branch is here).

Lessons learned while fixing memory leaks in our first Unity title

$
0
0
After several man months of tool making, instrumenting and compiling our own custom Mono DLL, and crawling through 5k-30k node heap allocation graphs in gephi, our first Unity title (Dungeon Boss for iOS/Android) is now no longer leaking significant amounts of Mono heap memory. Last year, our uptime on 512MB iOS devices was 15-20 minutes, now it's hours.

It can be very easy to construct complex systems in C# which have degenerate (continually increasing) memory behavior over time, even though everything else seems fine. We label such systems as "leaking", although they don't actually leak memory in the C/C++ sense. All it takes is a single accidental strong reference somewhere to mistakenly "leak" huge amounts of objects over time. It can be a daunting task (even for the original authors) to discover how to fix a large system written in a garbage collected language so it doesn't leak.

Here's a brain dump of what we learned during the painful process of figuring this out:

- Monitor your Unity app's memory usage as early as possible during development. Mobile devices have some pretty harsh memory restrictions (see here to get an idea for iOS), so be sure to test on real devices early and often.

Be prepared for some serious pain if you only develop and test in the Unity editor for months on end.

- On iOS your app will receive low memory warnings when the system comes under memory pressure. (Note that iOS can be very chatty about issuing these warnings.) It can be helpful to log these warnings to your game's server (along with the amount of used client memory), to help do post-mortem analysis of why your app is randomly dying in the field.

- Our (unofficial) low end iOS devices are iPhone 4/4s and iPad Mini 1st gen (512MB devices). If our total allocated memory (according to XCode's Memory Monitor) exceeds approx. 200MB for sustained periods of time it'll eventually be ruthlessly terminated by the kernel. Ideally, don't use more than 150-170MB on these devices.

- In Unity, the Mono (C#) heap is managed by the Boehm garbage collector. This is basically a C/C++-style heap with a garbage collector bolted on top of it.

Allocating memory is not cheap in this system. The version of Mono that Unity uses is pretty dated, so if you've been using the Microsoft .NET runtime for C# development then consider yourself horribly spoiled.

Treat the C# heap like a very precious resource, and study what C/C++ programmers do to avoid constantly allocating/freeing blocks such as using custom object pools. Avoid using the heap by preferring C# struct's vs classes, avoid boxing, use StringBuilder when messing with strings, etc.

- In complex systems written in C# the careful use of weak references (or containers of weak references) can be extremely useful to avoid creating endless chains of strong object references. We had to switch several systems from strong to weak references in key places to make them stable, and discovering which systems to change can be very tricky.

- Determine up front the exact lifetime of your objects, and exactly when objects should no longer be referenced in your system. Don't just assume the garbage collector will automagically take care of things for you.

- The Boehm collector's OS memory footprint only stabilizes or increases over time, as far as we can tell. This means you should be very careful about allocating large temporary buffers or objects on the Mono heap. Doing so could unnecessarily bump up your Mono's memory footprint, which will decrease the amount of memory "headroom" your app will have iOS. Basically, once Mono grabs OS memory it greedily holds onto it until the end of time, and this memory can't be used for other things such as textures, the Unity C/C++ heap, etc.

- Be very careful about using Unity's WWW class to download large archives or bundles, because this class may store the downloaded data in the mono heap. This is actually a serious problem for us, because we download compressed Unity asset bundles during the user's first game session and this class was causing our app's mono memory footprint to be increased by 30-40MB. This seriously reduced our app's memory headroom during the user's first session (which in a free to play game is pretty critical to get right).

- The Boehm collector grows its OS memory allocation so it has enough internal heap headroom to avoid collecting too frequently. You must factor this headroom into account when budgeting your C# memory, i.e. if your budget calls for 25MB of C# memory then the actual amount of memory consumed at the OS level will be significantly larger (approximately 40-50MB in our experience).

- It's possible to force the Boehm collector used by Unity to never allocate more than a set amount of OS memory (see here) by calling GC_set_max_heap_size() very early during app initialization. Note that if you do this and your C# heap leaks your app will eventually just abort once the heap is full.

It may be possible to call this API over time to carefully bump up your app's Mono heap size as needed, but we haven't tried this yet.

- If your app leaks, and you can't figure out how to fix all the leaks, then an alternative solution that may be temporarily acceptable is to relentlessly free up as much memory as possible by optimizing assets, switching from PVRTC 4bpp to 2bbp, lowering sound and music bitrates, etc. This will give your app the memory headroom it needs to run for a reasonable period of time before the OS kills it.

If the user can play 20 levels per hour, and you leak 1MB per level, then you'll need to find 20MB of memory somewhere to run one hour, etc. It can be far simpler to optimize some textures then track down memory leaks in large C# codebases.

- Design your code to avoid creating tons of temporary objects that trigger frequent collections. One of our menu dialogs was accidently triggering a collection every 2-4 frames on iOS, which was crushing our performance.

- We used the Daikon Forge UI library. This library has several very serious memory leaks. We'll try to submit these fixes back to the author, but I think the product is now more or less dead (so email me if you would like the fixes).

- Add some debug statistics to your game, along with the usual FPS display, and make sure this stuff works on your target devices:

Current total OS memory allocated (see here for iOS)

Total Mono heap used and reserved (You can retrieve this from Unity's Profiler class. Note this class returns all 0's in non-dev builds.)

Total number of GC's so far, number of frames since last GC, or average # of frames and seconds between GC's (you can infer when a GC occurs by monitoring the Mono heap's used size every Update() - when it decreases since the last Update() you can assume a GC has occured sometime recently)

- From a developer's perspective the iOS memory API and tool situation is a ridiculous mess:
http://gamesfromwithin.com/i-want-my-memory-apple
http://liam.flookes.com/wp/2012/05/03/finding-ios-memory/

While monitoring our app's memory consumption on iOS, we had to observe and make sense of statistics from XCode's Memory Monitor, from Instruments, from the Mach kernel API's, and from Unity. It can be very difficult to make sense of all this crap.

At the end of the day, we trusted Unity's statistics the most because we understood exactly how these statistics were being computed.

- Instrument your game's key classes to track the # of live objects present in the system at any one time, and display this information somewhere easily visible to developers when running on device. Increment a global static counter in your object's constructor, and decrement in your C# destructor (this method is automatically called when your object's memory is actually reclaimed by the GC).

- On iOS, don't be shy about using PVRTC 2bpp textures. They look surprisingly good vs. 4bpp, and this format can save you a large amount of memory. We wound up using 2bpp on all textures except for effects and UI sprites.

- The built-in Unity memory profiler works pretty well on iOS over USB. It's not that useful for tracking down narly C# scripting leaks, but it can be invaluable for tracking down asset problems.

- Here's our app's current memory usage on iOS from late last week. Most of this data is from Unity's built-in iOS memory profiler.

- Remember that leaks in C# code can propagate downstream and cause apparent leaks on the Unity C/C++ heap or asset leaks.

- It can be helpful to mentally model the mono heap as a complex directed graph, where the nodes are individual allocations and the edges are strong references. Anything directly or indirectly referenced from a static root (either global, or on the stack, etc.) won't be collected. In a large system with many leaks, try not to waste time fixing references to leaf nodes in this graph. Attack the problem as high up near the roots as you possibly can.

On the other hand, if you are under a large amount of time pressure to get a fix in right now, it can be easier to just fix the worst leaks (in terms of # of bytes leaked per level or whatever) by selectively null'ing out key references to leafier parts of the graph you know shouldn't be growing between levels. We wrote custom tools to help us determine the worst offenders to spend time on, sorted by which function the allocation occurred in. Fixing these leaks can buy you enough time to properly fix the problem.

iOS Memory Pressure Hell: Apple's 64-bit requirement+Unity's IL2CPP tech

$
0
0
Apple's 64-bit requirement combined with the newness of Unity's promising new IL2CPP technology (which you must use to meet Apple's 64-bit requirement) is costing us a serious amount of memory pain:


IL2CPP uses around 30-39MB more RAM for our 32-bit build. We've been struggling with memory on iOS for a while (as documented here). I honestly don't know where to find 30MB more RAM right now, which means our title on 512MB devices (like the iPhone 4s and iPad Mini) is now broken. Crap.

Some details:

Apple is requiring app updates to support 64-bit executables by June 1st. We've known and have been preparing to ship a 64-bit build of our first product for several months. The only way to create a 64-bit iOS build is to use Unity's new IL2CPP technology, which compiles C# code to C++:

The Future of Scripting in Unity
An Introduction to IL2CPP Internals
Unity 4.6.2 iOS 64-bit Support

The additional memory utilized by IL2CPP builds vs. the previous Mono-AOT approach is ~10MB for our code with an empty scene, and >30MB with everything running.

We've also tested the latest patch, Unity 4.6.5p4 (which is supposed to use less memory on iOS) with the same results.
Viewing all 302 articles
Browse latest View live